Charts.js not working

I’m trying to do https://jsfiddle.net/w764ozau/1/
in Meteor

It’s just a simple chart using the Charts.js.

I did the following:

  1. added chart:chart package

  2. added the html to my Chart template

  3. and now, where do I put the js code?

I tried inside

Template.Chart.onRendered(function () { ... }

But it doesn’t work. It’s either giving TypeError: Cannot read property 'width' of undefined
or it does nothing.

What does your Chart template look like?

<template name="Chart">
	<div class="row">
	  	<canvas id="myChart" width="400" height="400"></canvas>
	 </div>
</template>

There is nothing in it but this canvas element. and the js has only the onRendered function with the same code from jsfiddle

That should definitely work in the onRendered().

Let me just try this myself and get back to you.

1 Like

Okay, so I changed the package since chart:chart is very old and not maintained. Instead I used the official npm package. Here’s what I did:

meteor create chart
cd chart
meteor npm i
meteor npm i chart.js --save

Next, my main.html:

<head>
  <title>chart</title>
</head>

<body>
  {{> Chart}}
</body>

<template name="Chart">
  <div class="row">
    <canvas id="myChart" width="400" height="400"></canvas>
  </div>
</template>

and my main.js:

import { Template } from 'meteor/templating';
import { ReactiveVar } from 'meteor/reactive-var';
import Chart from 'chart';

import './main.html';

Template.Chart.onRendered(function() {
var ctx = document.getElementById("myChart");
  var myChart = new Chart(ctx, {
    type: 'bar',
    data: {
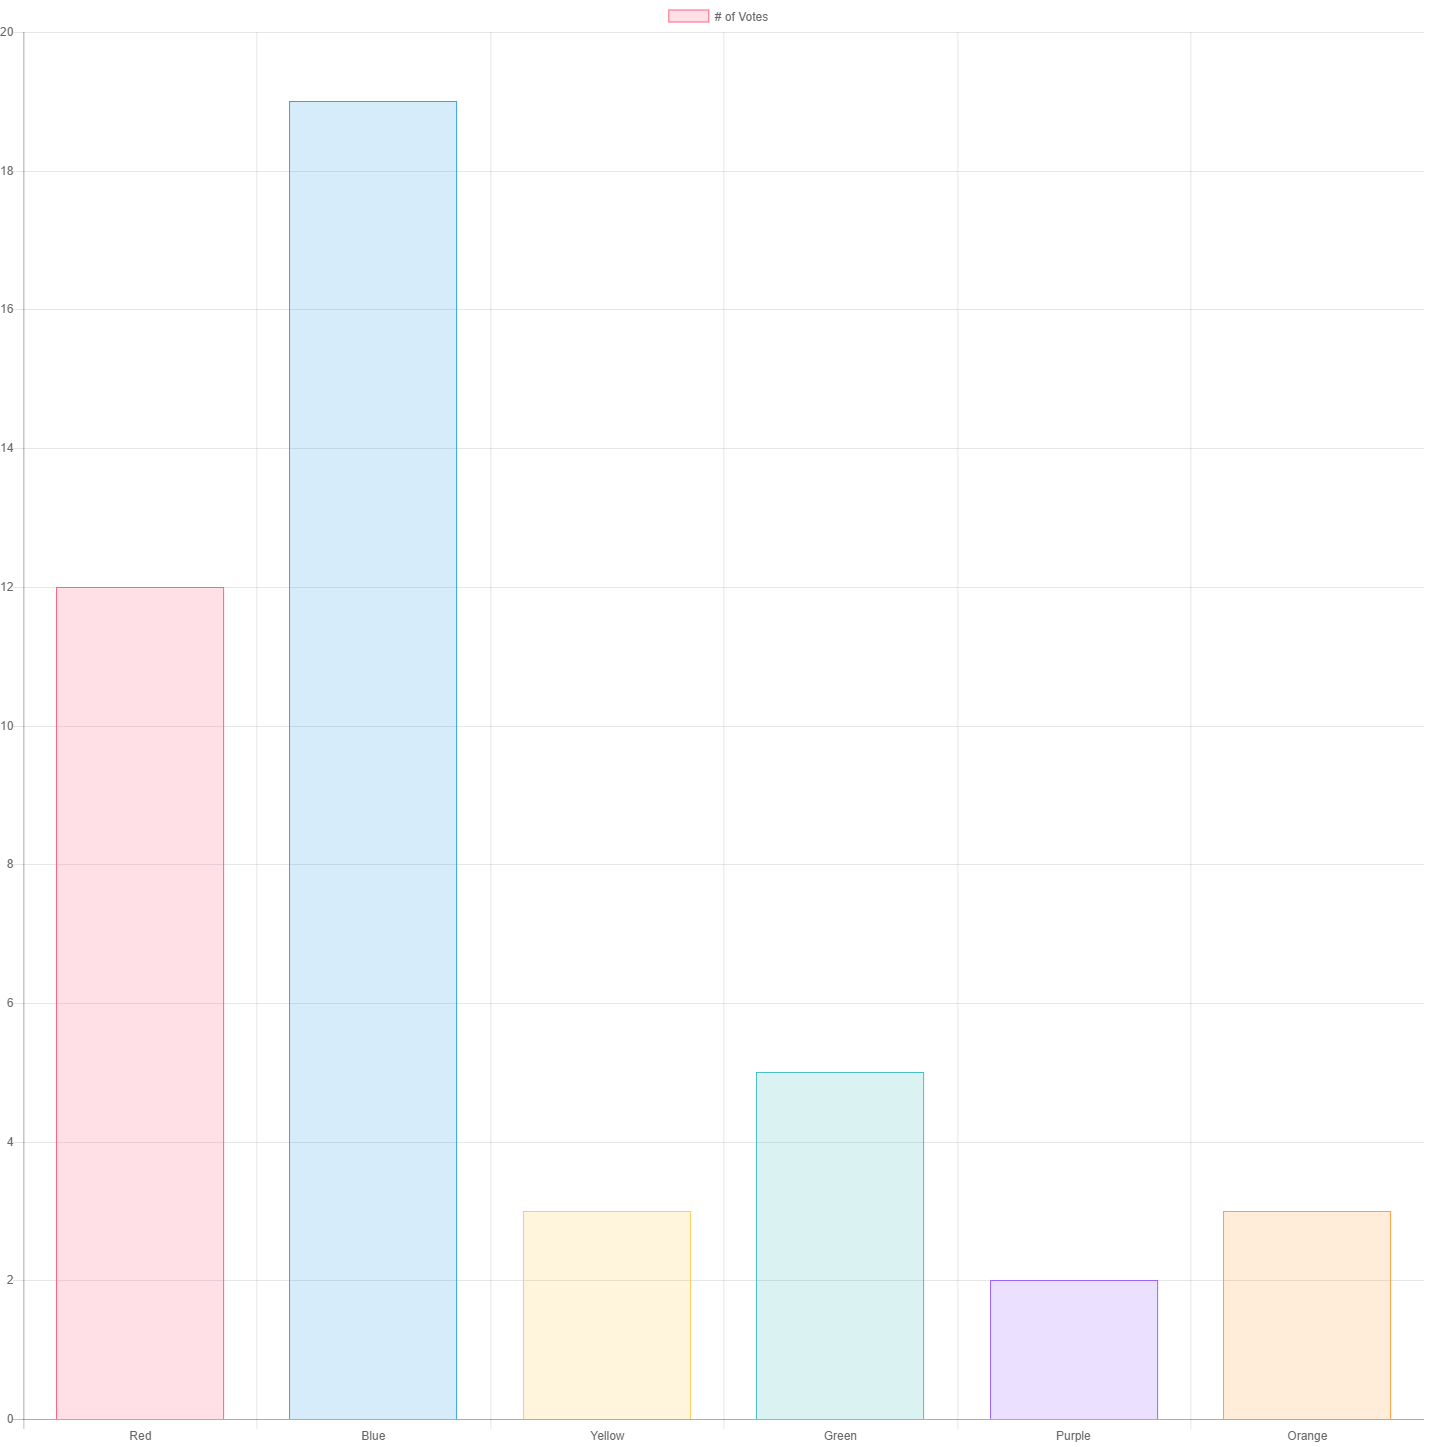
        labels: ["Red", "Blue", "Yellow", "Green", "Purple", "Orange"],
        datasets: [{
            label: '# of Votes',
            data: [12, 19, 3, 5, 2, 3],
            backgroundColor: [
                'rgba(255, 99, 132, 0.2)',
                'rgba(54, 162, 235, 0.2)',
                'rgba(255, 206, 86, 0.2)',
                'rgba(75, 192, 192, 0.2)',
                'rgba(153, 102, 255, 0.2)',
                'rgba(255, 159, 64, 0.2)'
            ],
            borderColor: [
                'rgba(255,99,132,1)',
                'rgba(54, 162, 235, 1)',
                'rgba(255, 206, 86, 1)',
                'rgba(75, 192, 192, 1)',
                'rgba(153, 102, 255, 1)',
                'rgba(255, 159, 64, 1)'
            ],
            borderWidth: 1
        }]
    },
    options: {
        scales: {
            yAxes: [{
                ticks: {
                    beginAtZero:true
                }
            }]
        }
    }
  });
});

Which is, I think what you would have used, except for the explicit import of Chart at the top.

4 Likes

It works!

Still, I also tried to put the html code:

<div class="row">
    <canvas id="myChart" width="400" height="400"></canvas>
  </div>

as is inside a larger template and it doesn’t work.
Looks like again (like the thread I opened on tooltips not working) it’s a rendering issue.

We use Chart.js successfully in our app, try adding a _.defer in your onRendered to give DOM the chance to render.

1 Like

I suspect this is the classic misunderstanding as to when onRendered is fired. This post may shed some light on what’s happening (although as we can’t see your “larger template” it’s speculation):

Thanks for sorting this out. I thought it will make it more convoluted if I add more templates inside templates but actually I see it’s the right way to go.

1 Like