Not specifically a Meteor question - but what could cause an app to spend a significant amount of time (e.g., 25% ) of CPU time in garbage collection, if it was not close to it’s memory limit?
In the last couple of days I’ve noticed the CPU usage of one server hits 100% and stays there until the server is restarted. I’ve found no pattern as to which method calls or publications could cause this, but today I ran a profiler on the server in question when it happened - and the only obvious problem was that garbage collection took 25% of the time, 10% of the time was just “program” the rest was distributed across a couple hundred function calls.
What could cause this amount of garbage collection? The server has 2GB of memory - and is the only thing running, it was using around 600MB at the time.
I dont think memory space is the issue - I’m using ~35% of memory - loads of space. I’m not convinced it’s actually a garbage collection issue - though it seems odd that GC takes 25% of time. I re-ran the profile on a healthy server and found GC taking 75% of non-idle time (though it was idle like 90% of the time)
I have no reference point on GC sadly. Nothing else (except “program”) looked out of the ordinary. I’m not sure how to upload cpu profiles - when I tried I get an error about file types. I’ve put them in an S3 bucket for now:
bad and bad2 are the same event at different times. Bad3 is (presumably) the same problem on a different server, good is a reference profile when the server wasn’t having problems.
When it happened on the second server, a restart didnt fix it - which makes me think that a method/publication isn’t completing. Unfortunately Kadira doesn’t track incomplete functions
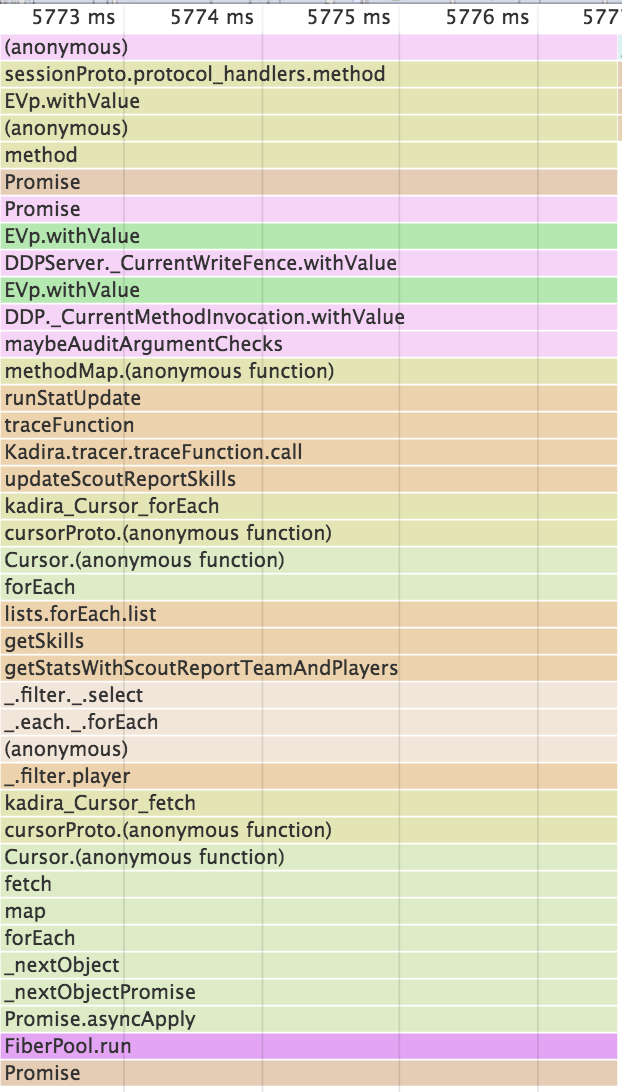
Luckily all of your issues seem to stem from a single Meteor method: runStatUpdate. In particular, the getStatsWithScoutReportTeamAndPlayers function called by the Meteor method seems to be fetching many documents (player documents I think) from the database. If you make this function less expensive (maybe decrease the number of player docs being returned?) or decrease the frequency with which you call runStatUpdate all of your problems should go away.
Here’s a representative slice from the CPU profile:
Thanks for looking, however this was the first place I checked because it does a lot of things, and requires a LOT of data - but its also used fairly heavily, and the bug comes up so infrequently I dont think this could be the problem.
We have a record of every method call, and the arguments, made during the time window today and re-running those same arguments doesn’t trigger the bug.
I’m about 99% sure its a publication or subscription and that the call isn’t completing - when we restarted the server during the bug, the bug came back 5 times once per restart. In theory this should make it easier to detect - but nothing I can see is causing this.
The problem appears to be caused by very specific arguments, which result in a query like this:
StatablePlayers.find({season: number, level: "string", playerId: undefined})- which returns way too much data.
Whats REALLY interesting:
StatablePlayers.find({_id: undefined}) returns NOTHING. It appears that the remove undefined doesnt apply to _id - which is part of what made this so hard to track down.
Thats not quite what happens - all the StatablePlayers have playerId’s, the problem is meteor is stripping undefined values from the query (I knew it did it, but its a recent change for us so we’re still finding the places where we have undefined values. What confuses me is why _id is treated differently - I guess meteor knows that you can’t have a document without an _id so “helps out”
Wow, that is an incredibly backwards incompatible change! We are using Meteor 1.6.0.1, so we don’t have this change yet. I’ll probably have to override the ignoreUndefined setting to be false…
Anyways, this explains why the query is returning so much data.
I looked at that too, but its not even an overridable option - you’d have to fork the package. I too was surprised and had the same problem, we jumped from 1.6.0 to 1.8 (because 1.6.1 had coffeescript problems and 1.7 had babel problems ;/)