I’ve been experiencing a memory leak on my production instance that hard resets my server once a day at the same time, like clockwork. Kadira says I have a lot of observers that are being created but never destroyed, which can lead to memory leaks.
There doesn’t seem to be much out there in the meteorsphere on this topic - could anyone point me in the right direction on this one?
Look for actual calls to “observe” and make sure each one of them is paired to a stop call.
observe returns a handle that you need to use to stop the observer when the publication stops.
Meteor will call stop on the publication whenever A) the client stops the subscription (either by ending it’s computation, or explicitly) or B) the client hasn’t responded to a certain number of heartbeats. So handling the onstop callback and stopping your observers there is the way to handle this.
If you aren’t calling observe directly, then look for publications that literally exist for the entire life of a client connection. If you have these, then lots of concurrent clients can be wasting observers, especially if they don’t have good reuse.
If you could point to some specific observers that are not getting cleaned up (if you keep drilling into individual publications in Kadira, you’ll find which ones don’t clean up) and can share some of what you are doing there, we can be of more help.
Wow this is great info, thanks for the speedy reply!
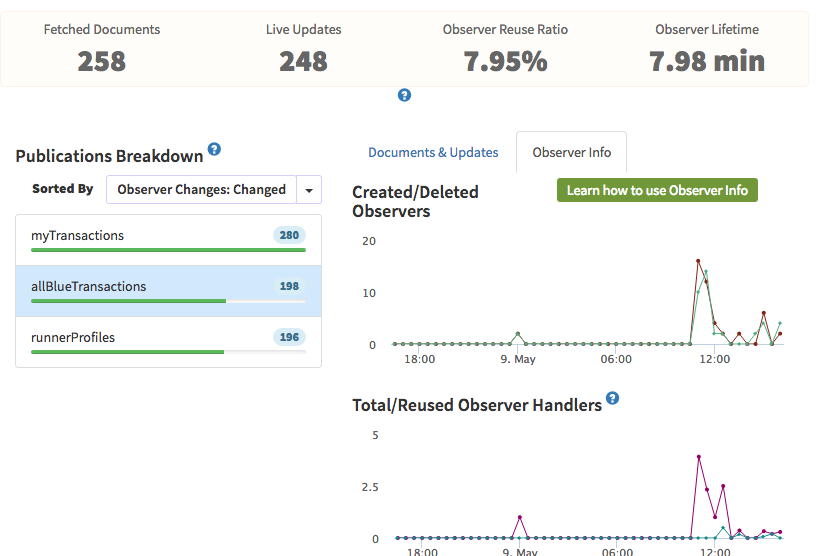
I’m in Dashboard > Live Queries > Pubs Breakdown & sorted by observers changed, this looks like it could be a potential candidate, but nothing seems out of the ordinary with the code. It also only ever gets subscribed to once, which might account for reuse being so less?
Anywhere more useful I should be looking to drill into these publications?
I am curious what your Counts.publish code looks like.
I will say this is likely not your actual memory leak as you will notice that the observer lines stay very close together. So observers are getting cleaned up reliably.
This does have a very low observer reuse, so it can be causing spikes, but as long as observer handlers drops back down as users leave, it’s not a leak.
I would check your other publications. Look for one where deleted observers trends below created, and total observer handlers continues to trend upwards. That would be your publication that is leaking.
It’s actually a package, percolatestudios:publish-counts. I dug into the code and found some observe code in there that might be causing spikes like you mentioned? We actually have 6 Counts.publish() calls that are subscribed to on render of our admin view (tracking different counts of transaction types), not to mention they’re all sizable.
The only other pub I can find that stands out in terms of created/destroyed is the one below. I can’t see more than a day back because of my plan but I think it may have something to do with the leak. First, because it’s a publishComposite, which also uses oberve. Second, we are using meteorhacks:subs-manager to cache the pub, and subscribing to it repeatedly all over the place, way more than we frankly should.
the publish-counts does have the cleanup routines it needs, so that’s not an issue.
publishComposite is a full featured wrapper around publish, so I don’t believe it is the issue either (I’m not seeing anything in their code indicating a memory leak).
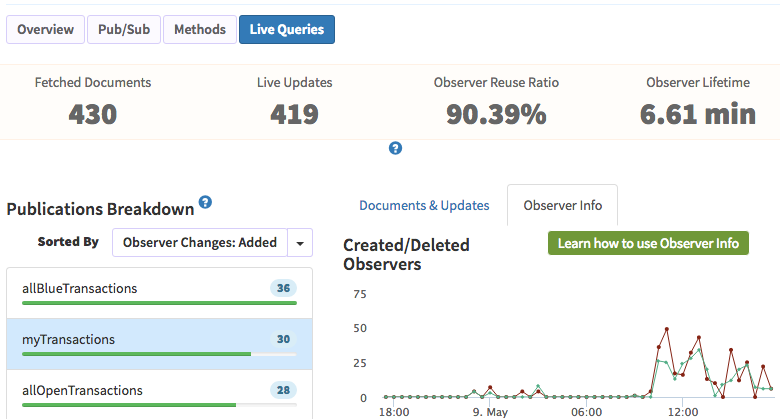
In your most recent kadira screenshot you show an observer lifetime of almost 7 minutes, with seriously large numbers of live updates. It is possible you don’t have a memory leak and instead just have seriously large memory requirements.
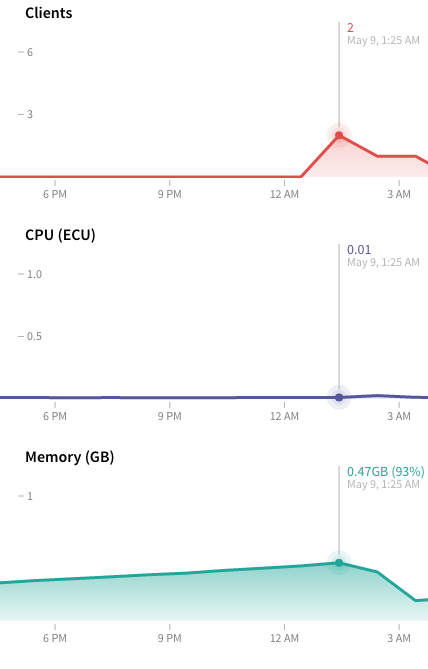
my core reasoning for the memory leak is that I get a steadily increasing memory over the course of the day - leading to a crash usually around 2am when we have few to none clients connected. I was getting the same behavior on Modulus and have been since we’ve switched to Galaxy.
Regarding memory requirements, we aren’t doing anything too complex/large scale that I would expect to suck up so much memory in such a reliable time frame every day. Would ‘over-subscribing’ to the same pub multiple times in a short timeframe cause the high created/deleted ratio? Possible I could also reduce this by using non-reactive cursors where applicable?
I’m curious what I can do to reduce the observer lifespan, it looks like kadira already recommends using subs-manager? but again the resources are tough to come by regarding this kind of stuff.
hey rob, I’ve actually run into that post - from my understanding altering the garbage collection policy is only possible with custom deploments, in that thread mupx / heroku.
i’m not entirely sure how this would be done on a galaxy setup?
Hmm. I would hope that MDG would have configured the garbage collection policy correctly for your instance size. Fire off a support request to confirm?
just shot off a request to the Galaxy team, going to start an identical isolated instance w/o any cron processes, etc. and see what kind of behavior I get as well.
will follow up when i hear back or make some progress, thanks guys!
Is there a reason why you’re using sort/limit? Try to refrain from that.
Perhaps you could do something like this instead:
Date.prototype.retardedDay = function(days){
	return new Date(this.getTime() - days*86400000);
}
var yesterday = new Date().retardedDay(1)
var newQuery = _.extend(txs.status.blue, {timeRequested: {$gte: yesterday}})
return transactions.find(newQuery)
Don’t sort on the server, do it on the client, assuming your current limit is “small”.
The $gte mongo query will perform the limit for you in a more performant way.
And if the limit isn’t small? Sort and Limit reduce query reuse, but would not be causing a memory leak.
Additionally, there is literally nothing wrong with having mongodb do your sort and limit server side. The only thing that keeps this query from being reused is the fact that limit can change.
In this case, this code is unrelated to his problem.
we’re dealing with some relatively large amounts of data / limits - assuming the way we’re publishing will do just fine for now…
wrt the leak, i actually just caught the servo at 98%, did a stop/start and it went back down to 36%. not sure if that’s high for a meteor app but something definitely seems leaky.
sidenote, also heard back from galaxy support. atm, they use Node 0.10 for all application containers and use the default garbage collection policy across all containers. it’s also not currently something they would be able to change for specific containers. i’ve noticed the container IDs change on stop / start, might have something to do with that.
It’s a bit high, but might not be leaky at least in terms of the app itself. It could be that either there is a memory leak not found yet in the meteor core, or, you may have hit on some of potential leaks in the v0.10 node garbage collector which wasn’t very good at the time. The v4 garbage collector is much better, and it’ll be nice when we get there.
As a note, most garbage collectors run in an interesting hybrid mode which for the most part is “as needed” and as such will get a climb in memory. 98% is pretty high, but taking up 2x-3x as much memory as technically required is pretty normal. If you’re on a 512MB servo, you might just need to up to 1GB to give the garbage collector more breathing room.
I guess until Meteor 1.4 has a stable RC we’ll have to wait and find out, seems like a garbage collection thing to me at this point - i’m just surprised I haven’t come across any related behavior on the forums.
the weirdest part to me is the steady creep upward…2x-3x increases would be in reason but shouldn’t it tie to increased client usage? I’ve got a clone of the app running on a separate container and have been stripping away different crons/packages, hopefully that’ll lead to something.
also i’ll give the servo a bump see if that does anything - we’ll see what happens