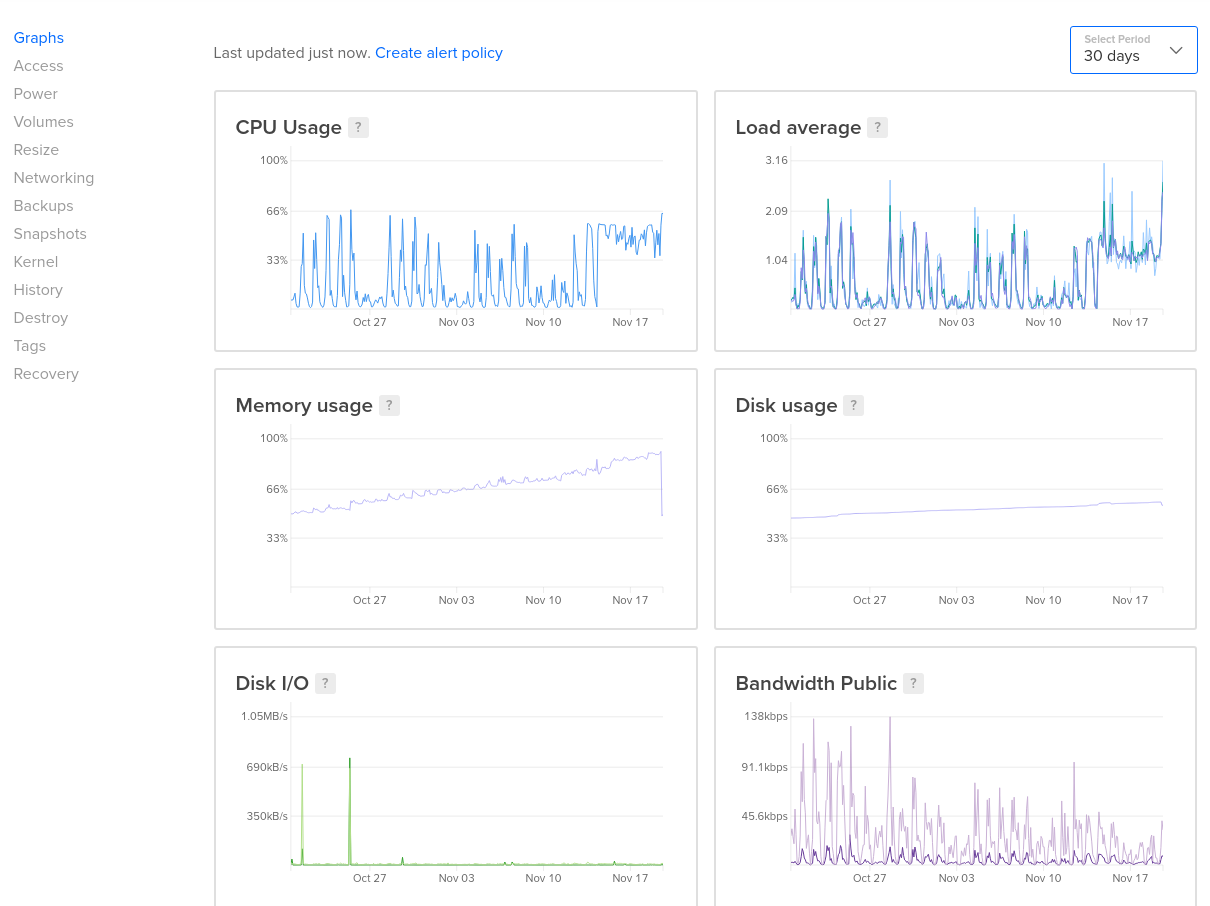
We’ve created live-chat application for websites. It uses rocketchat:streamer@1.0.2 to send information about typing messages. All the data (including messages) stored in MongoDB. As you can see in the screenshot from DigitalOcean, memory (RAM) usage increasing from 50% to 90% for 30 days. But if restart Meteor app, memory usage decreases to ~50% again.
We’ve tried to find reason, but unfortunately we have not any idea and didn’t find any helpful information about this problem.
Hi, are you using any APM tool for Meteor like MontiAPM?
I believe this would be the first step to understand where this increase in memory consumption is coming from.
Unfortunately only with this Memory usage chart is very hard to help you as we don’t know what is happening.
2 Likes
You should be able to run a profiler and find the issue relatively quickly in local development, if not when deployed with something like MontiAPM. I would guess this is on the application-side somewhere, with variables being held onto so they can’t be cleaned up by the gc
1 Like
I started to look into this as well. I have a project in standby. All out in the public but quietly. So, what I did …
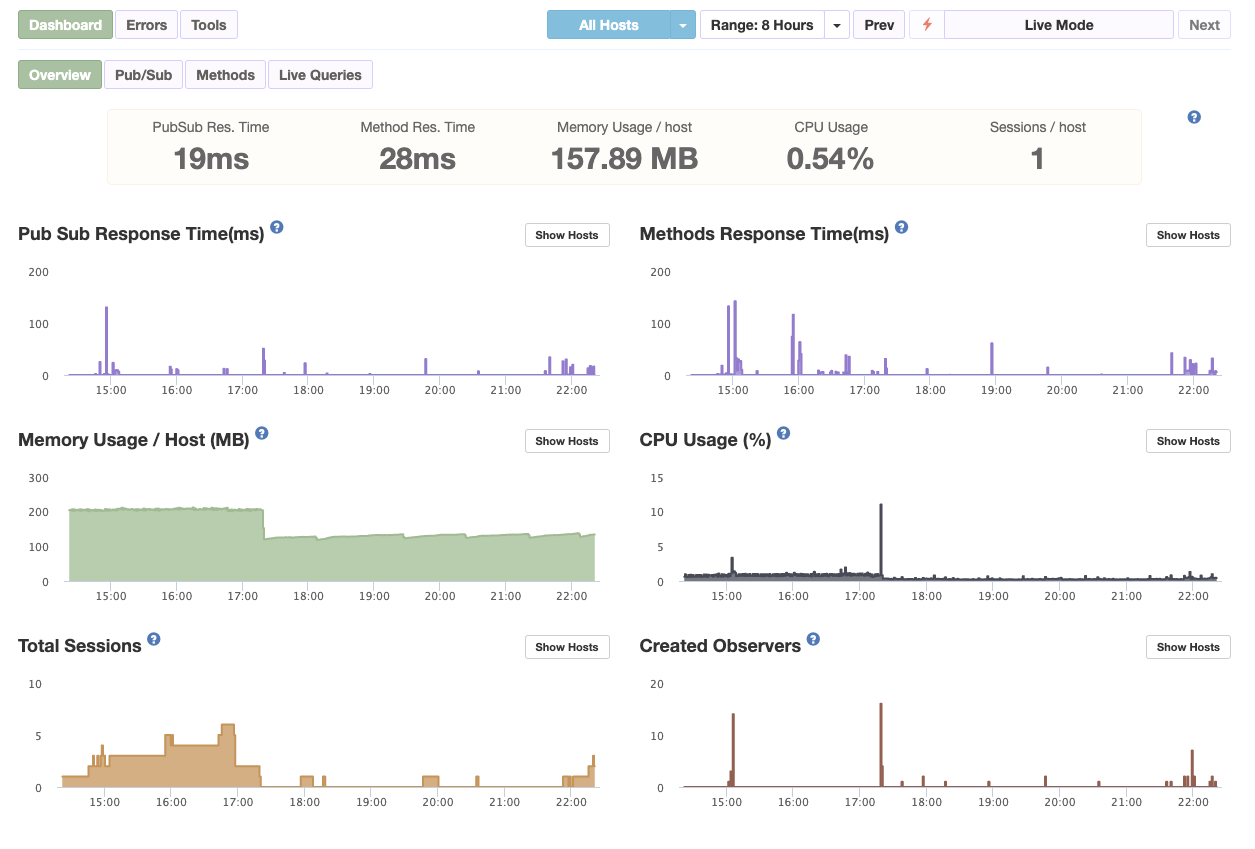
With just 1-2 users (myself), memory would sit at around 145 MB. Then in the image you can see (on the CPU) the time when I run a load test (with LoadImpact) with 50 users. CPU went 100% and another box was started (I use MUP with AWS EBS). Test load was finished, memory remained up (~210 MB) until my next deploy (or restart). In the second image, 10% CPU is when the app was re-deployed and the memory freed. Also after that, there are those small memory waves associated with small spikes in CPU, a pattern that I started to see with 1.9-rc.2 and was curious to know how it looks on a highly loaded server with many users. Do the waves and the spikes grow in amplitude or are they as unnoticeable like on my almost standby project.
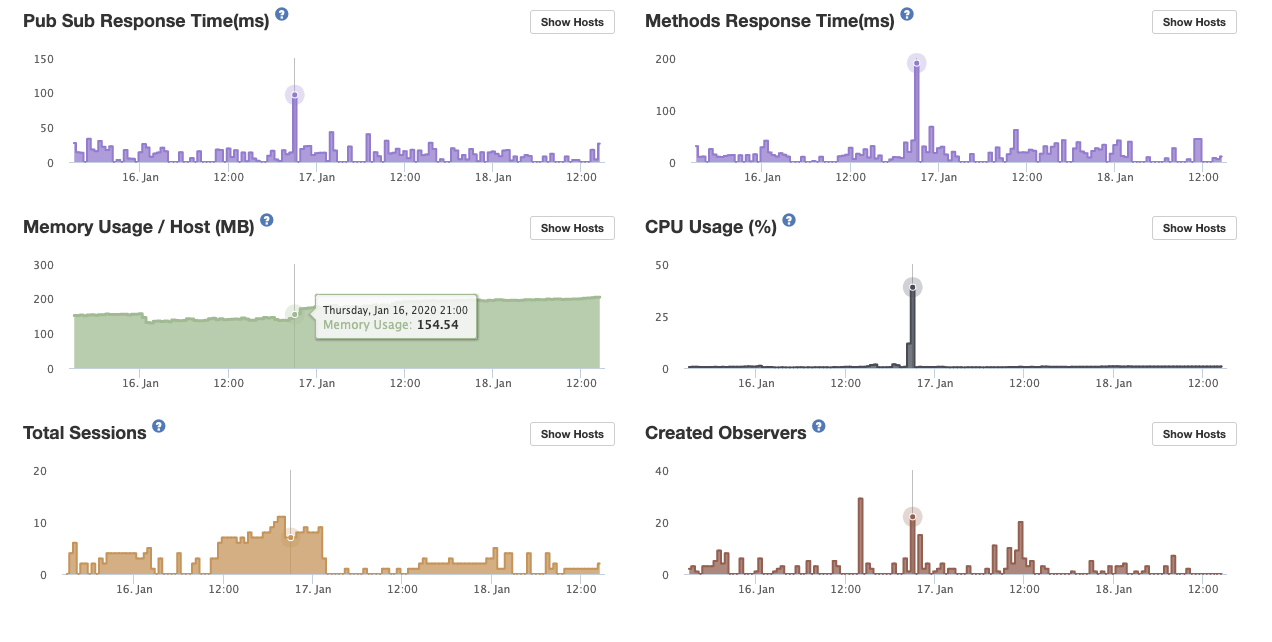
I use at least 95% methods and use a mix of ready available data in Redux with lazy load on scroll etc. For those who use lad balancing, it is pretty fine to run a one-by-one restart every x days
Yes but looking at your charts, the CPU/memory peak starts when observers are created.
However, your charts look fine, because it is just a peak, after which all goes back to normal.
In the chart from @cubicsinc you can see CPU and memory don’t go down anymore. Only a restart solves it. Imo that looks like a classic example of the notorious observer memory bug, but AMP charts would show for sure.
Btw, almost 20 observers are created, could be caused by incorrect scrolling debounce.
PS, And yes you are right, methods are the way to go with Meteor. Pub-sub is ‘magic’, but expensive magic, use any super power with extreme caution ![]()
PPS imo a one-by-one restart every X days is not fine, it is avoiding problems.
Check out this comments on git https://github.com/meteor/meteor/issues/9796#issuecomment-569495943
The issue is still out there (after all those years) and looks like it got worse with 1.9