Meteor perfomance issues with collection observeChanges

Hi everyone!
I’m working with a meteor app that’s having some performance issues from time to time, and we’re not able to determine the cause.
I’ve found a way to run kadira in-house so we can take a better look at it, and found that sometimes there are really high times on collections observeChanges (I believe this is done by the publish/subscribe mechanism).
This is an example:

image

We do have an index on “profile.storeId” and “profile.accountId”, ran the query using explain and took nothing to fetch the users.

Is there any way I can troubleshoot this kind of problems? Any advice is much appreciated. Thanks!

1 Like

@luistensai how big is that cursor, I don’t see any limits in there ? How many documents are returned and how big ? You need to understand that observeChanges() fetches the data in full. Look here for scaling reactivity: https://github.com/cult-of-coders/redis-oplog

1 Like

Hi @diaconutheodor
There are only 15 documents returned by that query, I checked in mongo and the cursor size is 1043 (I think it should be just a kb). All the 15 documents should weight less than 70k. We’re not trying to fetch a lot of users at the same time.
I’ve seen some issues with collection fetchs too, eg: trying to retrieve a user by email takes around 3 seconds.
image
You can see there’s a limit and there’s actually an index for “emails.address” in the users collection by default, and there’s actually any user with that e-mail, so it returned 0 results.
Thanks for your reply, will investigate redis-oplog, but our current workload isn’t really that much, I really don’t understand why some operations take too long.

Could you try taking a profile with https://atmospherejs.com/qualia/profile ?

If you are using observe / observeChanges, not that there’s a memory leak issue there. My advise: do not use in production! We’ve completely migrated away from using observeChanges, for example by replacing with a method instead.

HI @satya!
We’re not using observe / observeChanges afaik, are they just part of the normal publish/subscribe mechanism? If that’s the case, then we have a problem, as we have lots of subscriptions going on our apps actually.
Thanks for your reply!

Do the performance issues you are having correlate with bulk updates on the db (not necessarily on the same collection or the same process)?

@luistensai you’re looking in the wrong place, it’s not Meteor to blame it’s the database, make sure you have proper indexes set up, and make sure it’s in the same intranet so it doesn’t spend too much time on the wire, finding a user by email 3s is ridiculously slow.

No the normal publish/subscribe doesn’t have the issue.

However, I strongly suggest to move from publish/subscribe to methods any time you don’t need reactivity - and I’m pretty sure most of the time you don’t need it. Just fetching data over methods is so much faster. In our product (https://www.postspeaker.com) we’ve replaced almost all publish-subscribe, except where we really need reactivity. It was a dramatic speed increase.

Also make sure to always limit your fields for every db query, and implement proper indexes.
Last, make sure your database is in the same data center or region as your app.
And finally check if you can move (publication) query logic to the mongo aggregation pipeline.

If you follow these patterns your app will be fast.

@hluz we don’t currently have bulk updates on our db. Most of the updates are single document updates.

@diaconutheodor that’s a possibility, but finding the object actually takes nothing, the find call is above and it took 0ms, but fetching the document or observing the collection is really slow. Our db is in an external provider, ObjectRocket. They provide a direct wire to our datacenter; we have different applications running on express and they don’t have problems so far with the latency, so I’d think that the problem is in meteor pubsub mechanism or we’re doing something wrong.

@satya thanks for the advices, I think we need to move away from publish/subscribe. Looks like it’s an overhead right now. We liked the idea of reactivity, but sounds like it’s giving more problems than solutions right now.

As a side note, I should say that we notice the cpu going to 100% whenever we start seeing a rise in users logged into our app concurrently, so this might be related to the cpu spikes caused by Fibers and subscriptions.

@luistensai just add redis-oplog and experiment with it, you don’t need to fine-tune anything, but I would definitely try it to see the outcome.

There are other ways to solve reactivity. For example, you can poll a method, but you could also publish a count of the collection, and if the count increases, you fetch the actual data via a method. Or let the user click to fetch the new data (like Twitter does).

But in general Meteor’s pub-sub is an interesting idea that works for proof of concepts / mvps, but as far as I’ve experience for real production apps it is not scalable at all.

I don’t think there’s anything fundamentally wrong with pub/sub, it’s just that the diagnostic tools don’t make it super easy to figure out what’s going on.

So the question is; does the query get slow because there is a 100% CPU usage, or does the CPU rise to 100% due to this observer.

These issues are more common lately:

1 Like

I’ve been observing Kadira a bit better lately and fixed some issues, mostly observer reuse ones, that made the app behave a bit better, but issues still continue.
I’ve noticed the cpu spikes appear when we have lots of oplog notifications. EG:


What does this mean? Looks like there are updates modifiying a lot of objects at the same time and affecting all the subscriptions? Is there any way I can search for a place where this is being done?
Thanks everyone for helping!

@luistensai Yep, the issue is here in the OplogDriver

When documents are updated in MongoDB, the driver must decide whether it can apply the update directly from the oplog, or whether it needs to re-fetch the updated document.

The issue arises, when an update causes meteor to fetch thousands of updates simultaneously (rather than serially / batched), which causes a huge spike of fibers & cpu usage.

When you call collection.update( ... ), there are two main cases that may decide if a document “needs to be fetched”

  1. Minimongo could not apply the modifier (complex/unsupported updates)
  2. The update was on fields that you were publishing by,

eg.

// given a few thousand published documents
(new Array(2000)).forEach((n)=> collection.insert({ field1: 0, n}))
Meteor.publish(null, () => collection.find({field1: { $lte: 1 } }))

// If there's a subscribers, every document affected by this update will need to be re-fetched
collection.update({}, {$set: {field1: 10 }}, { multi: true });

Unfortunately the latter one is harder to avoid, eg, if you’re publishing archived posts to user A, and then user B archives many thousands of posts, it will trigger this issue.

4 Likes

So, I think we can probably avoid this in our app, as we’re currently not publishing more than a hundred records to each user, and we only have around 200 concurrent users. Many users belong to the same group and share same subset of records in the publish/subscribe. Users can only update documents one by one, but our rest api might be updating several documents at once.

My question is, everytime I update records from a collection, will it generate an oplog notification for each updated record on the active subscriptions? will that notifications be only for the subscriptions that match the updated object queries?

I really doubt we need to update 10M documents at the same time (please check the oplog notifications chart I’ve pasted), so our bug must be in our code, generating some sort of in chain reaction updates and collapsing our servers…

edit: Our active subscriptions count and subscription rates look constant all the way, we only experience cpu problems when we receive a LOT of oplog update notifications.

thanks @nathan_muir for the explanation!

That’s why I asked this above

Yes, sorry, the problem is we actually don’t know if there’s a bulk update being done, but there might be one nearly 99% sure. I say this because our oplog spiked from 6k operations to 600k operations for the same amount of time on different time frames.

Thanks for all your help!

I’m a little late to this conversation, but as a tip, your problem is probably a method that does does something of the form of:

Collection1.find().forEach(function(doc1) {
  Collections2.update({joinedField:doc1.field}, ...);
});

or

Collection1.find().forEach(function(doc1) {
  Collections1.update({_id: {$in: doc1.arrayField} }, ...);
});

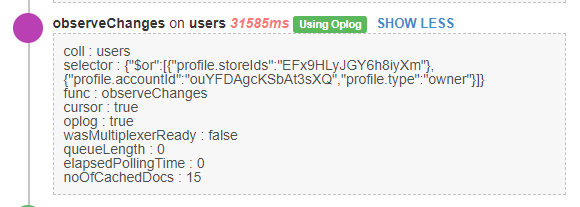
or, most likely from the numbers you’re seeing in your oplog:

Collection1.find().forEach(function(doc1) {
  for (var i = 0; i < doc1.fieldB; i++) {
    Collections2.update({joinedField:doc1.field}, ...);
  }
});

Think about how you can restructure these to use an update with {multi:true}. Start by investigating your slowest methods in Kadira. If you can’t do a multi-update, make sure when you do these joins, you don’t accidentally replace the document; or, like in the third example, quadratically increase the number of documents you modify.

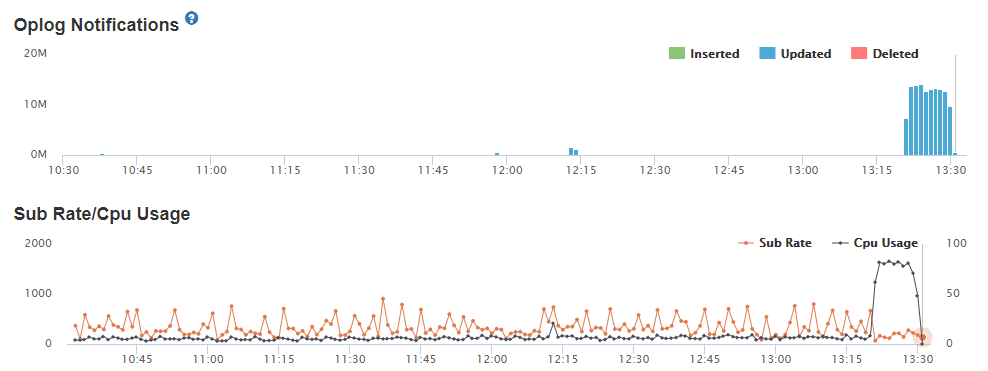
This is based on the reading of your oplog notifications, which generate a huge number of updates. Naturally, a publish and subscribe, as long as it’s not radically buggy, won’t update your database for you.

My bet is, actually, in your client code, you have a Collection.update that gets called, eventually, by rendering code, and coincidentally it is doing an extremely slow and noisy join across hundreds of concurrent users for you.

1 Like