Not trying to cast stones but sharing this for the broader community but the official stance now is no 2.x releases. Not even backports, fixes or any improvements to ease migrations. So makes no sense @dupontbertrand for you to try to get readings on performance. Drop 2.x.
2 Likes
Fiooou, quite a Saturday. Here’s what happened today on the benchmark front.
Dedicated server
We now have a Hetzner CPX42 (8 vCPU AMD EPYC, 16 GB RAM, Nuremberg) running nothing but benchmarks. No desktop, no GUI, no cron jobs, no shared runners. Just Meteor, MongoDB, and Artillery.
MongoDB 7.0 and Node 22 — same versions as Meteor’s dev bundle.
Server tuning
Getting reliable numbers took a few iterations. Here’s what we ended up with:
- CPU pinning — Meteor gets cores 0-3, Artillery/Chromium gets cores 4-7 via
taskset. They don’t fight for CPU anymore. - MongoDB restart between each scenario — clears WiredTiger cache and open cursors so each scenario starts fresh.
- Filesystem cache drop between scenarios —
echo 3 > /proc/sys/vm/drop_caches - 5-second cooldown between scenarios for the OS to settle
- Parasitic services disabled — apt-daily, fstrim, motd, all turned off
This made a huge difference. Our early runs had GC max pauses of 5+ seconds that turned out to be just noise from lack of isolation. With the setup above, the same metric dropped to ~40ms. Lesson learned: benchmark methodology matters more than the numbers themselves.
Two repos
We split things into two private repos:
- bench-dashboard — the Blaze dashboard app, deployed automatically to Galaxy via push-to-deploy
- meteor-bench-agent — the benchmark CLI, scenarios, collectors, and the polling agent that runs on the server
The old performance repo is archived.
How it all connects
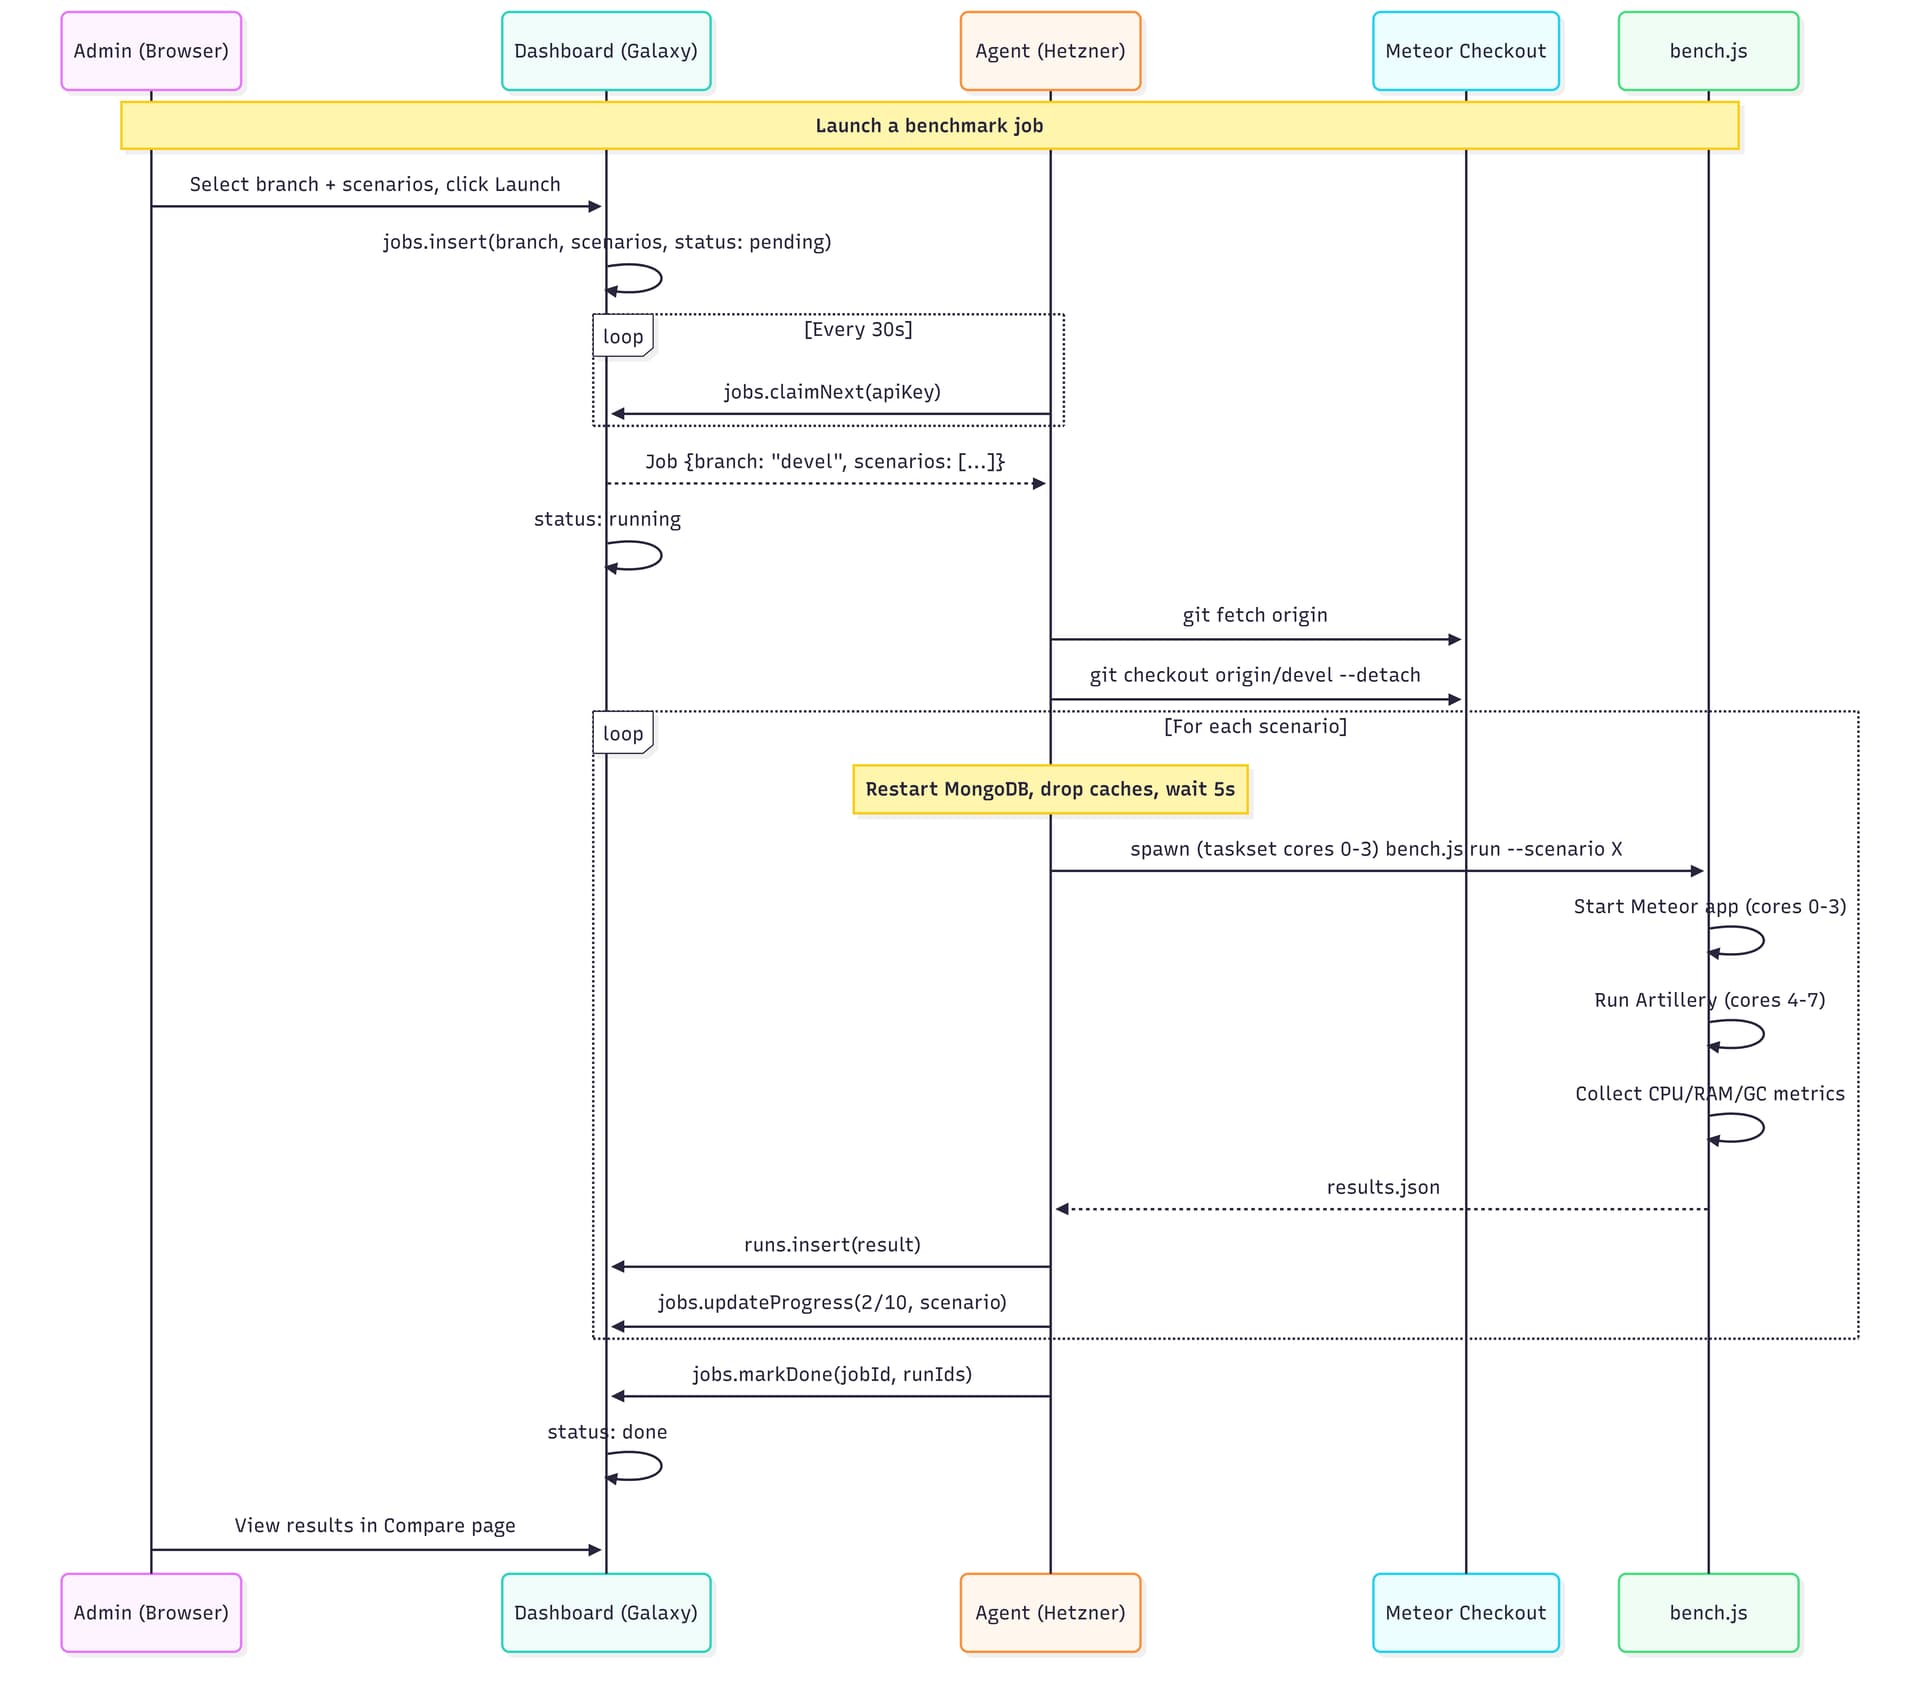
The agent polls every 30s, picks up pending jobs, runs them sequentially, and pushes results back. There’s an admin page where you can select a branch from a dropdown (synced from the Meteor repo — all 1,900+ branches), pick scenarios, and hit launch.
Dashboard updates
- Compare page now shows all scenarios side by side with the run date in the header, so you can see if you’re comparing runs from the same day
- Scenario names are clickable in the compare view
- Tooltips on each metric explaining what it measures
- Copy JSON button for easy data export
- About page rewritten with full methodology — CPU pinning, isolation steps, server specs
- Agent status visible in the admin panel (Online/Idle/Offline)
- Job progress in real-time (3/10 reactive-light, etc.)
First real comparison: devel vs release-3.5
All 10 scenarios, 240 concurrent Chromium sessions on the heavy ones. Same machine, same day, full isolation between scenarios.
The headline: release-3.5 has dramatically better GC.
| Scenario | Metric | devel | release-3.5 | Delta |
|---|---|---|---|---|
| reactive-crud (240 browsers) | GC total pause | 4,813 ms | 756 ms | -84% |
| reactive-crud | GC count | 970 | 299 | -69% |
| reactive-crud | Wall clock | 927s | 687s | -26% |
| non-reactive-crud (240 browsers) | GC total pause | 26,929 ms | 5,914 ms | -78% |
| non-reactive-crud | Wall clock | 373s | 267s | -28% |
| ddp-reactive-light (150 DDP) | GC count | 653 | 107 | -84% |
| ddp-reactive-light | RAM avg | 371 MB | 489 MB | +32% |
release-3.5 does 3-5x fewer garbage collections and spends 67-84% less time paused in GC. The trade-off is ~30% more RAM usage — it keeps objects alive longer instead of constantly allocating and collecting. For users, this means fewer micro-freezes and more consistent response times.
The exception — cold start:
| Scenario | devel | release-3.5 |
|---|---|---|
| cold-start | 16s | 36s |
| server bundle | 91 MB | 207 MB |
devel cold-starts in half the time. The server bundle is also half the size. Worth investigating what changed there.
What’s next
- Environment flags — compare sockjs vs uws transport, DISABLE_SOCKJS, etc.
- MongoDB-focused scenarios — read-heavy (100K docs), bulk writes, aggregation pipelines
- Split cold-start into build time vs boot time
The dashboard is public and read-only: https://meteor-benchmark-dashboard.sandbox.galaxycloud.app
Go to Compare, select devel vs release-3.5, and browse all 10 scenarios. The About page has the full methodology if you’re curious about how things are measured.
Would love feedback on what other comparisons would be useful!
3 Likes
thas is really fantastic!
3 Likes
3.4 is the current production version. So 3.5 should not introduce performance regression.
Can we compare 3.4 vs 3.5 ?
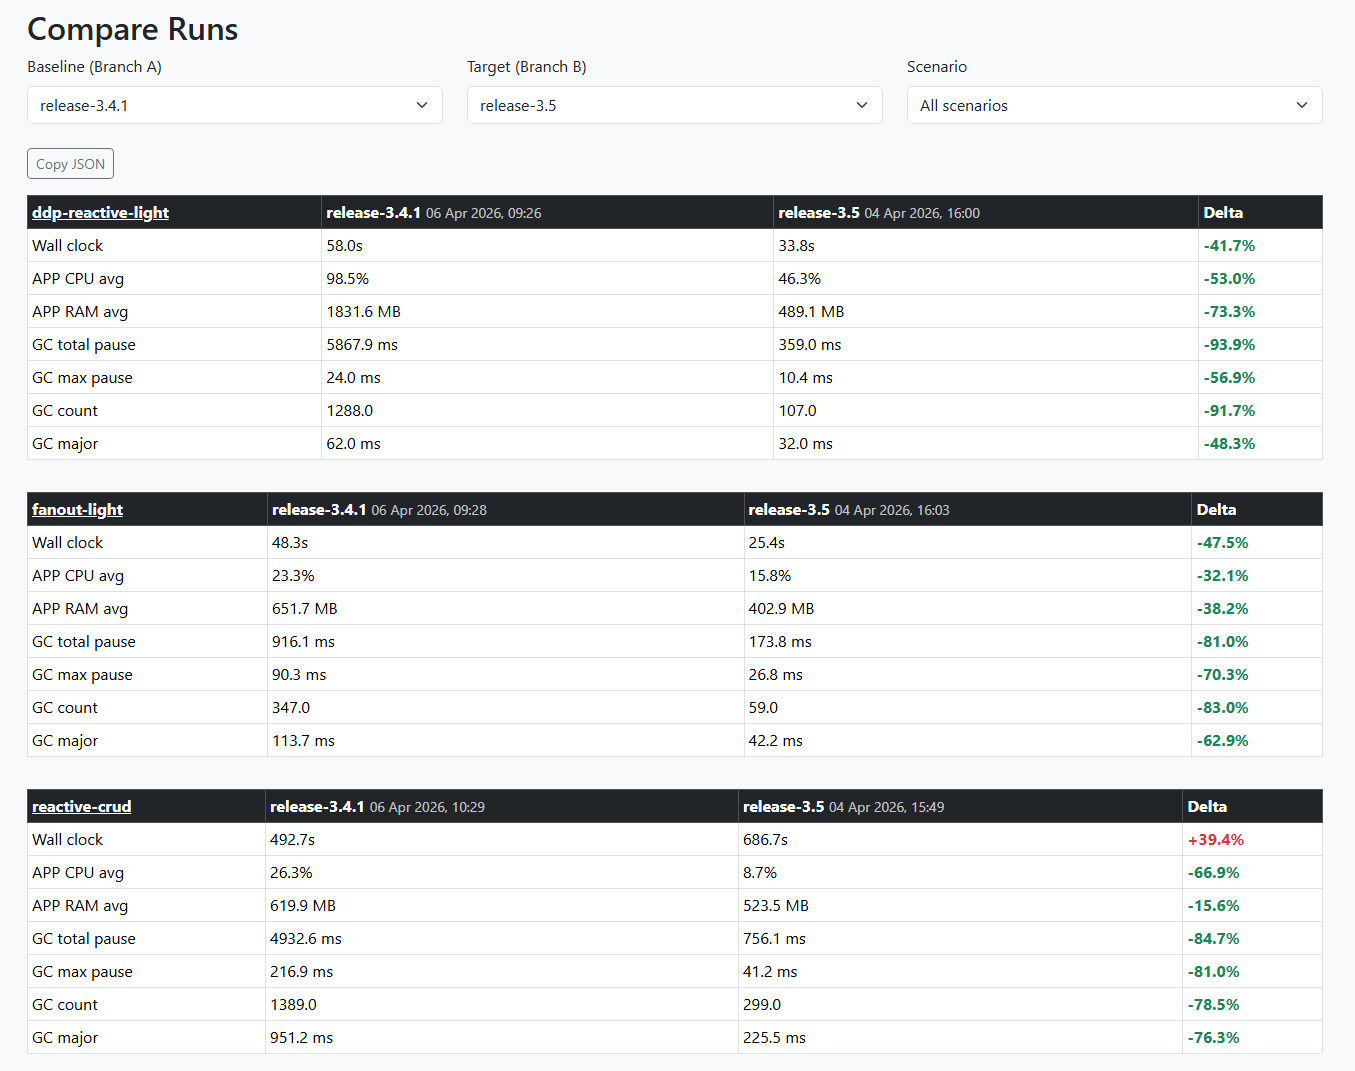
Yes, huge diff between this two! ![]() But I made some changes on the server between the 2 runs so I’m restarting the 3.5 scenarios to be sure
But I made some changes on the server between the 2 runs so I’m restarting the 3.5 scenarios to be sure ![]()
4 Likes
You take the dashboard offline?
I noticed it’s offline too.
I took a few hours to study the project, and I’m planning to structure it so we can eventually bring it into the Meteor core. For now, I’ve hosted a version on Galaxy: https://meteor-benchmarks.us.galaxycloud.app/
Feel free to push your benchmarks there. All env variables and secrets are using their default values since, as I mentioned, this is just for experimental purposes.
it’s hosting a fork of the fork’s dupon, so dupon updates wont be reflected there
I think this would be really useful! Those of us still to make the move are going in blind in terms of performance and even though we can test in staging etc, there will always be surprises. What sort of issues did you hit ?
Not trying to cast stones but sharing this for the broader community but the official stance now is no 2.x releases. Not even backports, fixes or any improvements to ease migrations. So makes no sense @dupontbertrand for you to try to get readings on performance. Drop 2.x.
In terms of new features I understand noone will invest time and I get that… but actively discouraging someone to work on supporting a release that will benefit lots of people doesn’t really land well.
Hello everyone, sorry, I’m having a huge spike in work/client projects right now ![]()
Yes, the dashboard was offline. The app was deleted by mistake by the Galaxy team because it was incorrectly flagged as inactive, I believe. It has been re-uploaded, but I still need to hook up a database to it, and I really don’t have a minute to spare at the moment ![]()
I’ll do it sometime this week, but if the Meteor team can take it over and integrate it into core, that’s perfect — that’s exactly what I was hoping for! Also, the server isn’t free either ![]()
4 Likes
Update on the benchmarking
https://meteor-benchmarks.us.galaxycloud.app/
Over the last weeks I’ve been iterating on top of @dupontbertrand 's work, with two main goals:
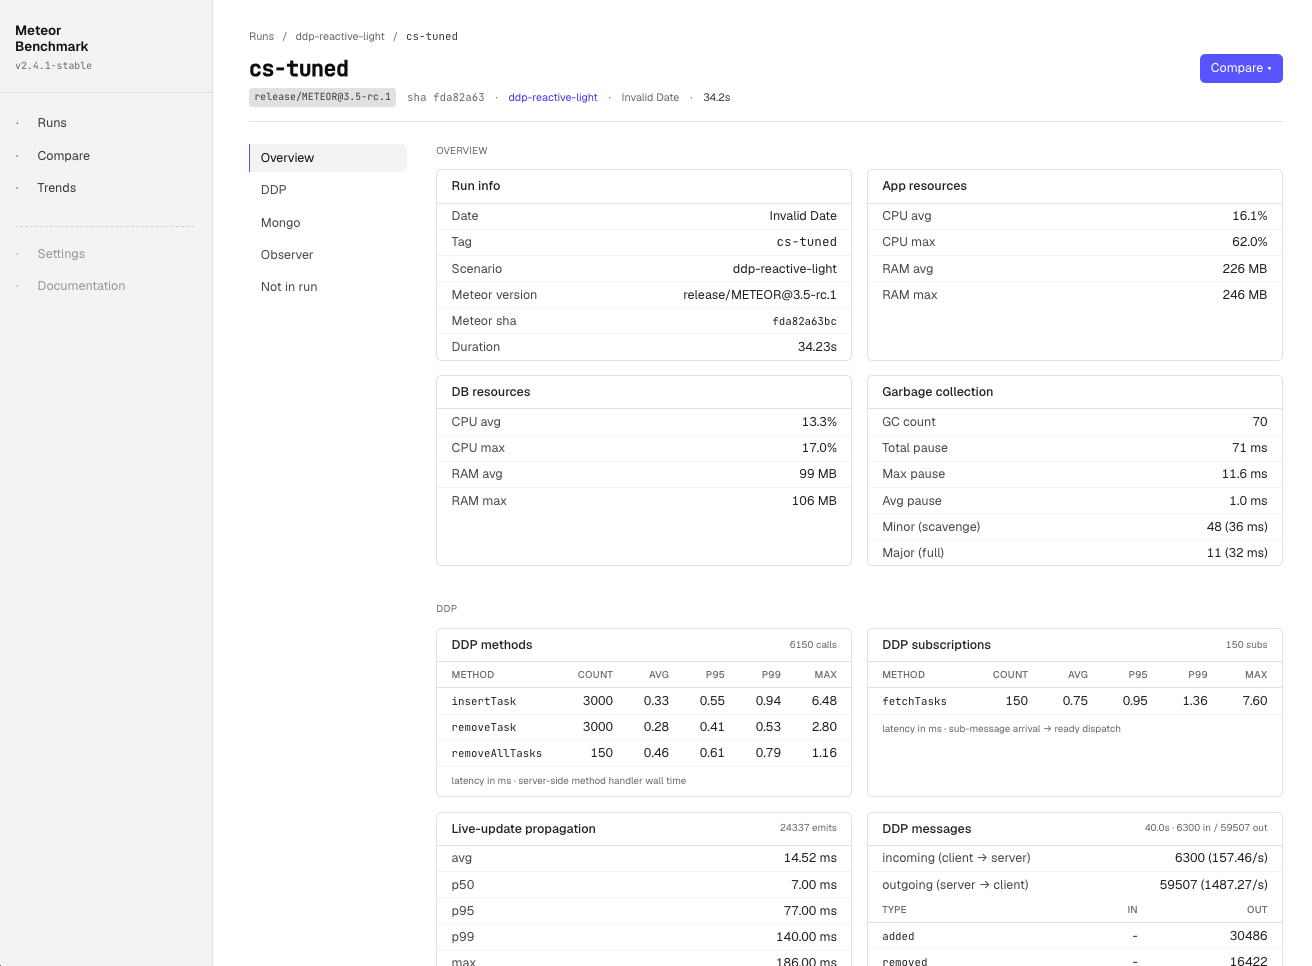
1. Deeper telemetry
The original framework tracked CPU / RAM / GC / event loop — enough to detect regressions at the macro level. I extended the collector set to ~16, breaking down each Meteor subsystem:
- Mongo:
mongo_ops,mongo_pool,mongo_slow_queries,mongo_index_usage,mongo_changestream,mongo_wiredtiger - DDP:
ddp_methods,ddp_subscriptions,ddp_messages(broken down by type: sub/method/added/removed/changed/…),ddp_frame_size,ddp_compression,live_update_propagation - Observer pool & drivers:
observer_pool,driver_fallbacks(ground-truth per-cursor — tells you if you asked forchangeStreamsbut actually gotoplog) - Build:
build_profile(METEOR_PROFILE hot nodes),plugin_compile
This gives us per-metric Δ% on the Compare page in the dashboard. Useful for pinpointing where a regression actually lives.
2. Polished UI (with no offense intended @dupontbertrand ![]() )
)
The dashboard got a visual refresh too. Same Blaze stack, but rebuilt with Tailwind, a denser layout, and proper dark/light theme toggle (defaults to dark, persisted in localStorage). The tables are tighter, deltas are color-coded, and the Compare page now sorts by biggest regression first.
In my (very biased) opinion it looks a lot cleaner now. But the underlying contract is unchanged — same publications, same data shape, same dashboard URL — so all the runs @dupontbertrand pushed back in March still render and compare just fine.
Where this stands
The framework keeps everything @dupontbertrand built — the dashboard, the CI matrix, the comparison views, the Release Health page. On top of that:
- Modular harness (CLI / drivers / runner / reporters split out — easier to plug a new collector or scenario)
- 413 unit tests via
node:test(no Meteor needed, runs <5s) so we trust the numbers - tasks-2.x removed (per the consensus here from @harry97 and others)
- support for pinned Meteor releases (
--meteor-version 3.5-rc.1) in addition to local checkout, so we can run the matrix against any RC without rebuilding
All credit for the foundation goes to @dupontbertrand. The cs/oplog insight only became visible because his framework was already in place, I just extended the instrumentation until the bottleneck was undeniable.
[edit]
note: the current status still is a WIP, so please expect a few bugs or UX inconsistencies
4 Likes
Wow, thanks a lot for the credit ![]()
Congrats on picking the topic back up. I would have loved to keep working on it and push it further, but I was starting to lose focus and go in too many directions, and the app being deleted was the final straw haha ![]()
Really nice work, just 2–3 small things:
1/ Feel free to make it so that when we compare two branches, the URL updates / the page reads the URL dynamically to pre-fill the page. That way, if we want to share runs, it’s easier than saying “Go to compare, select this branch and that branch.” I had realized that at some point
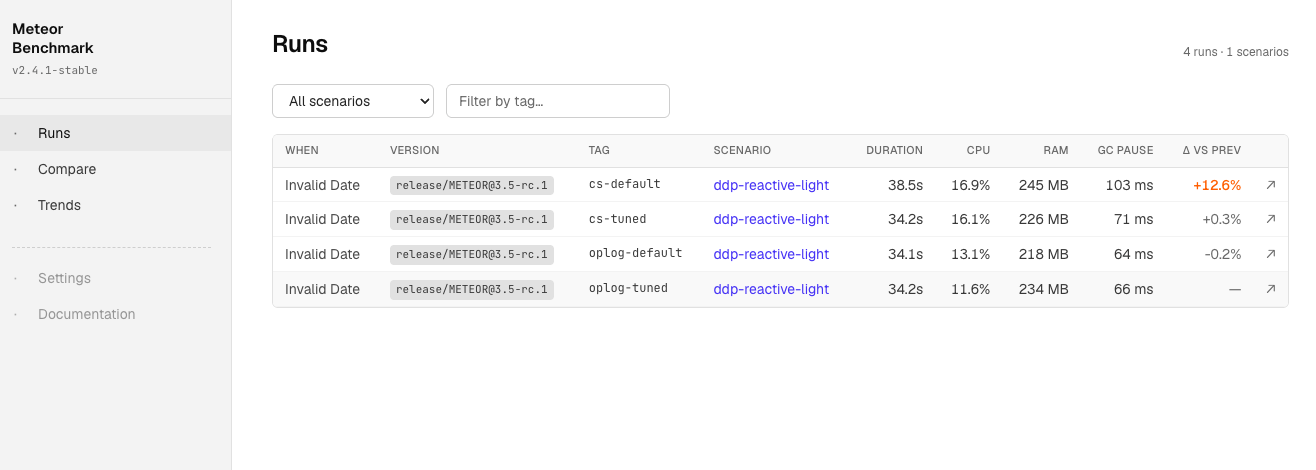
2/ From https://meteor-benchmarks.us.galaxycloud.app/, I feel like you can’t click on a run to go directly to the run details page, like for example https://meteor-benchmarks.us.galaxycloud.app/run/trNXhweic8YqufHRj. Oh wait, you can, but only via the small arrow. Could you make the whole row clickable instead?
3/ Are you using sockjs? Meeeh ![]()
4/ On the homepage, I don’t really understand the last column, “Δ vs prev”. What is “previous” here? The previous run of the same version?
5/ The “Trends” tab shows 0 runs / 0 versions for me. Is that expected?
Thanks again, good job boss! ![]()
1 Like
agree 100%
lol, will update to 3.5 soon
It’s a garbage from previous version I worked on, in some moment I tried to present the diffs in the homepage but the UX wasnt good enougth.
The work still in progress, so is expected to find a few bugs
added a note in my previous post: note: the current status still is a WIP, so please expect a few bugs or UX inconsistencies