What version of Meteor are you using?
I’m having the same problem. No users and CPU use staying at 99%. I’m running Meteor 1.4.1.1 on node 4.5.0. I have plenty of ram free and have tried rebooting.
This is only happening on the server. My local dev version doesn’t break above about 14% even with use.
Here we are running Meteor 1.2.1 with node v0.10.40.
Exactly the same issue, happening only on production environment.
If it can help, even after restarting meteor/phisically restarting the server the process goes automatically to 100%.
The same if I build up a new instace on aws with the same settings/db.
Here is what happened to me last times…
Meteor works normally, at one point the CPU goes crazy for hours and after a huge downtime the cpu from 100% goes down by 0.1% per second until reaching 6% (My normal usage)
Edit: More informations
You guys really need to take some CPU profiles on your production server when it is exhibiting the issue; if it’s stuck at 100% CPU and you profile it, it should give a pretty clear indication as to what’s causing it.
So I’ve done some experimenting. In my mongo database I had ~38,000 records. When I remove all but 600 of them it becomes nice and snappy again and CPU usage drops to 1-2%.
Note the maximum number of records ever subscribed to was about 200. The high CPU usage occurs even if the app has never been visited by a browser which seems bizarre.
And again, it’s working fine locally with an identical dataset.
You guys should know your application and how you use certain packages.
SimpleSchema is usually used to validate forms on the client, to validate method-calls (if you use mdg:validated-method) or to validate collection-inserts and updates with aldeed:collection2.
If simpleSchema pops up in your server-side-cpu-profile, this means that you do either a lot of validated method-calls and/or a lot of database-updates / inserts.
Then, verfiy if this is normal for your app (an app with lots of users and lots of write-operations) or if it is a client-side bug (clients invoke too much method-calls).
Also check if you have server-side-db-hooks or similar that do db-writes periodically
2 Likes
I’ve been profiling the CPU and sometimes it’s hard to profile it because Kadira just doesn’t get the resources.
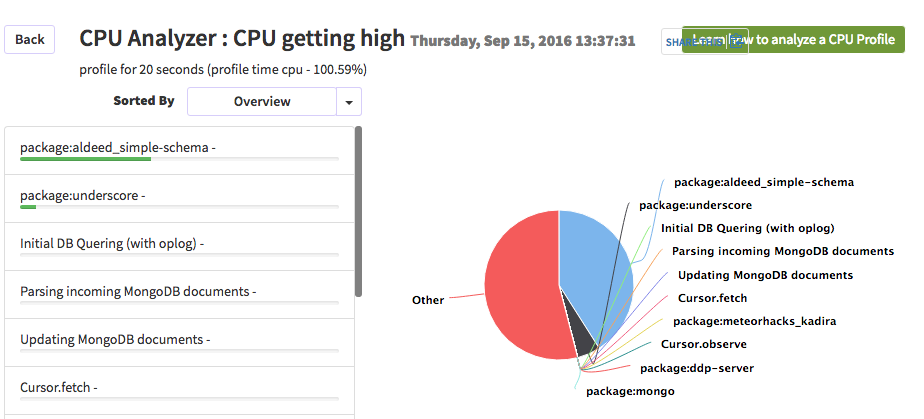
But so far I’ve been lucky and I’ve got the the profile of the CPU when it was 100%. The package aldeed:simple-schema seems that was using a lot of CPU (screenshot)
Perhaps is as @macrozone says that we are using simple-schema wrong… ̶̶I̶ ̶t̶h̶i̶n̶k̶ ̶w̶e̶ ̶a̶r̶e̶ ̶n̶o̶t̶ ̶u̶s̶i̶n̶g̶ ̶a̶l̶d̶e̶e̶d̶:̶c̶o̶l̶l̶e̶c̶t̶i̶o̶n̶2̶
(No server-side-db hooks here, probably)
Can you not drill-down more into what’s using all the CPU within that package?
I am not stating, that you are using it wrong. I am stating, that it is maybe just a symptom, not the reason for your performance-problem. 
1 Like
You are right, could it be that the origin of my problems are the ones higlighted in this screenshot?
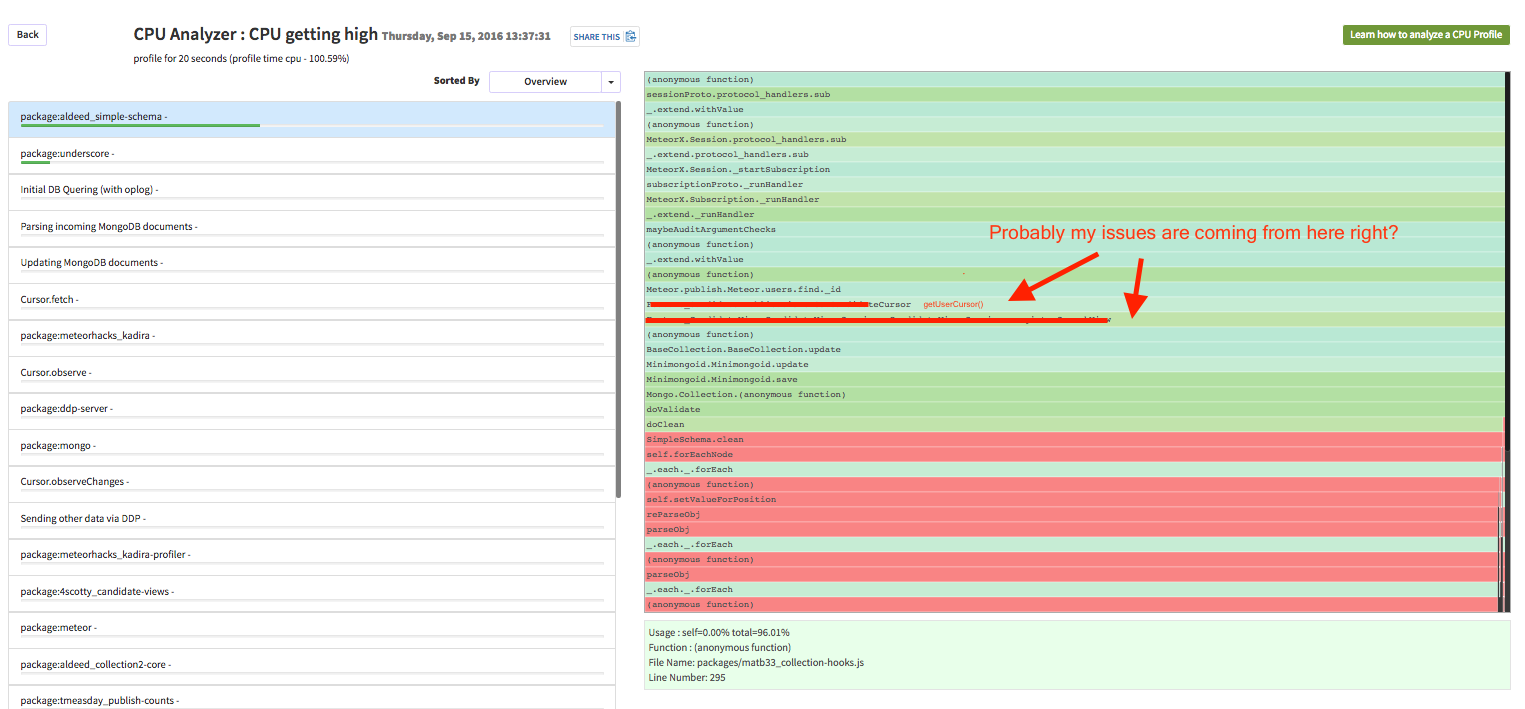
I think I’ve found my problem. The following code works perfectly locally but bogs down the CPU on the server:
var initializing = true
Records.find({}, {transform: null}).observe({
  added({type}) {
    if (!initializing) {
      Records.update({ _id: type }, { $set: { recordCount: Records.find({type}).count() }})
    }
  },
  removed({type}) {
    if (!initializing) {
      Records.update({ _id: type }, { $set: { recordCount: Records.find({type}).count() }})
    }
  }
})
initializing = false
This approach is suggested at e.g. http://stackoverflow.com/questions/21355802/meteor-observe-changes-added-callback-on-server-fires-on-all-item
So I think somehow the Records.update code is being run for each record on startup. Like you suggested @macrozone.
@xunga, if you have something similar it would explain why your CPU eventually settles down to your normal 6%.
Is there a better way to avoid running the added hook for .observe for every record on startup?
If you are trying to add hooks into the DB, why not use https://github.com/matb33/meteor-collection-hooks or take a look at the way he does it, I use it and it works flawlessly.
3 Likes
Done. Everything is working nicely now, and with reasonable CPU usage. Thank you.
I knew it! 
What you can also do is throttle these kind of aggregation-tasks with _.throttle
So multiple “added” or “changed”-callbacks will only start an aggregation once in a certain time-frame
1 Like