I wasn’t aware of this either. This might explain why I couldn’t find any methods that might be prone to blocking. Will check and unblock the pubs as well.
1 Like
This is indeed a very good question.
That’s actually coming from the old Kadira performance guide. As zodern pointed out in the other thread about performance, he got the permission from Arunoda to include these docs in the MontiAPM docs.
In general, I’d also love to see these docs in a broader “Meteor performance guide”, but having it in MontiAPM would definitely be a big step forward, especially as zodern is so experienced with Meteor.
Hiding these cool infos behind the Wayback Machine is not the way to go 
2 Likes
Still we have this odd theory that somehow a publication may cause this by getting blocked (i.e. “not returning”??), and thus the DDP message flow is interrupted. This however, begs the question what could make a publication to “not return”; where and how can it get blocked in the first place? I’m very curious about this.
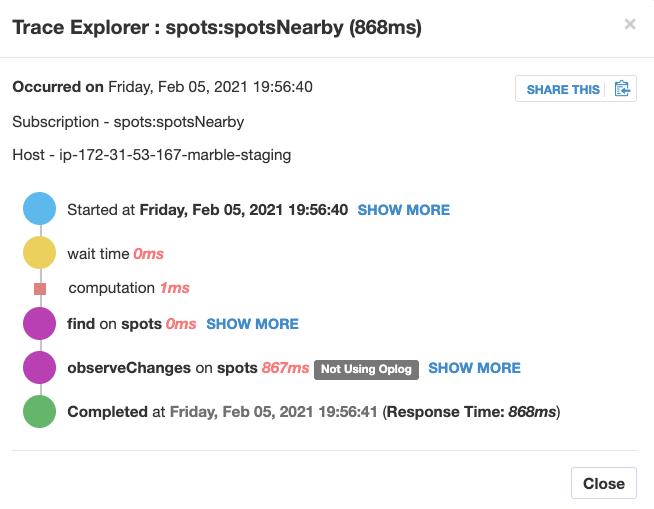
I followed @filipenevola’s recommendation to unblock all methods. This seemed to work find for a couple of days. But today, I suddenly noticed that the response times of my app increased drastically. For some methods, I see 22 secs or more:
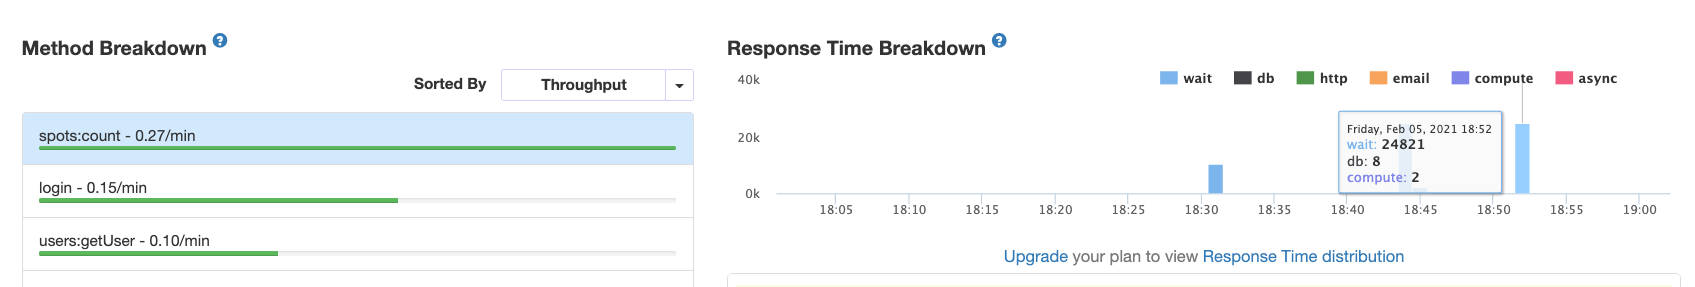
This method returns a simple count of all documents in a particular collection, i.e. just an integer. The response time is insane.
Same goes for pubs:
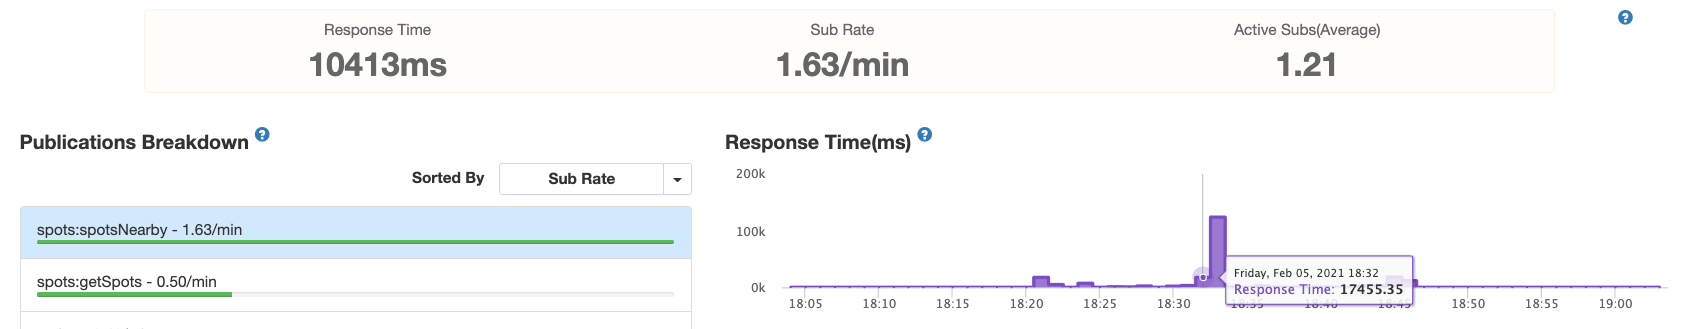
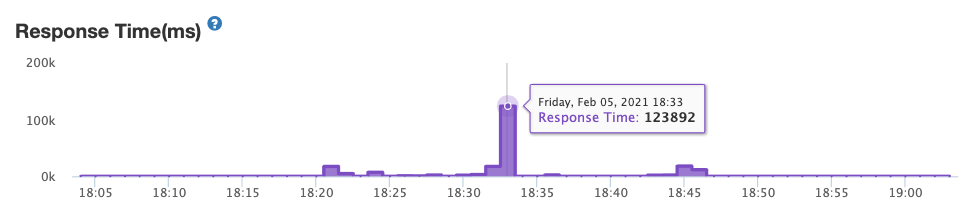
They even spiked to an insane 123 secs once:
(That sub includes a geospatial query, in case that matters.)
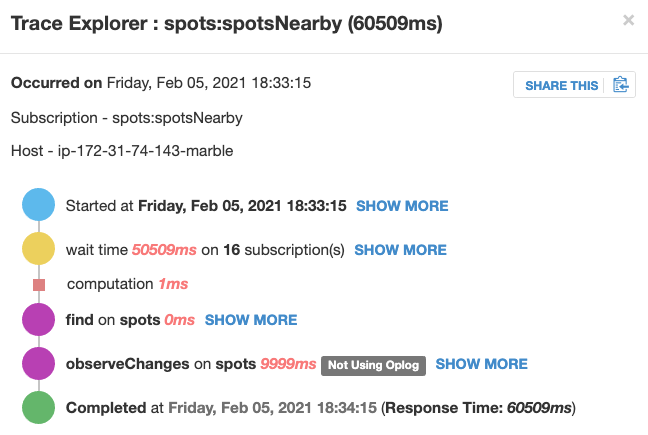
Here’s the trace of that particular case:
(Please note that I haven’t unblocked the pubs yet.)
At first, I thought this might be caused by Mongo DB Atlas, but looking at the traces, I can see that most of the time is being spent “waiting”.
The app got pretty unresponsive now. Even restarting the server didn’t help. Never saw such a behavior before. On my dev and staging systems, everything works fine.
Any idea what’s going on here?
@waldgeist you need to unblock pubs.
But why your observeChanges takes 9secs? Could you please share info about this section?
This happened to me several years ago, so I can’t remember what the exact issue was, and Meteor could have changed since then. But I started using this.ready() in all my publications to ensure that they are returned.
Not 100% if all this info is still relevant, since this is from 2015, but this post explains things: This.ready in a publication? - #10 by manuel
2 Likes
@peterfkruger was so nice to have a look at the system with me, in a longer web session ![]()
What we noticed, and what’s pretty strange: The production server and the staging server behave completely differently, using (almost) the same code base.
On the staging system (which is running on a t2.small instance), a typical pub trace looks like this:
which is pretty normal.
Whereas on the prod server (running on a t2.medium), it looks like this:
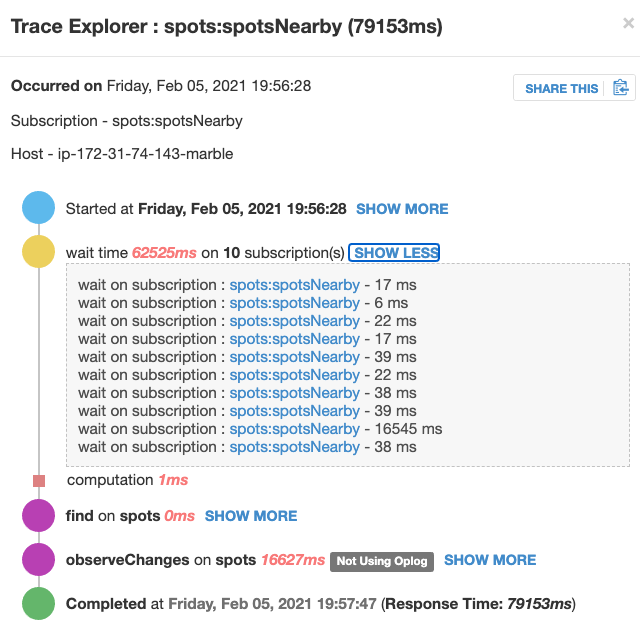
My explanation for the multiple subscriptions: This is a map where we panned across, which causes parameter updates and thus re-subscriptions for another map viewport.
The reason why one of the sub takes longer than the others is that this was on a low zoom level so there’s more data on the map. But still, we’re talking about a hundred vs. 5-6k elements, this won’t explain why it takes 1000x longer.
Plus, we did exactly the same user interactions on both the prod system and the staging system, so we are wondering why on the staging there is almost no wait time, whereas on the prod there is (same data)? There was no significant user load on both of the systems at that time.
The reason why “Not using oplog” shows up here is that I am using a $nearSphere query for this sub. As I just recently learned, Meteor falls back to non-oplog in this case. But that’s also the same for the staging system. I even stopped and restarted the EC2 instance now, but the problem still persists. I’m pretty clueless why this happens.
(Another very strange thing: If I start the app in Chrome right after starting the browser, the initial map load works fine. But as soon as I reload the page or pan to another map location, the sub starts to stall again. On Firefox and Safari, however, the problem occurs even on initial page load. @peterfkruger accessed the same systems on his PC hundreds of miles away, with the exact same results. So it’s not a network issue or something like that.)
What puzzles me the most: How can the same app under (almost) identical conditions (slightly larger EC2 instance, larger MongoDB cluster on the prod system) behave so differently?
2 Likes
I am curious why this is even necessary. Is it because the DDP connection waits until the first ready() is being called? I mean, pubs don’t really “end”, unless you unsubscribe.
1 Like
From Publish and subscribe | Meteor API Docs
If a publish function does not return a cursor or array of cursors, it is assumed to be using the low-level added / changed / removed interface, and it must also call ready once the initial record set is complete .
This should only be necessary for pubs using the low-level API. But maybe I missed something?
1 Like
Yeah, you’re correct. But if you don’t return a cursor or an array of cursors from the pub, then it assumes your using the low-level API.
So it’s just a best practice that you ensure that all pubs are returning either a cursor, an array of cursors, or this.ready() to avoid any potential issues.
Taken from http://docs.meteor.com/#/full/meteor_publish
// server: sometimes publish a query, sometimes publish nothing
Meteor.publish("secretData", function () {
  if (this.userId === 'superuser') {
    return SecretData.find();
  } else {
    // Declare that no data is being published. If you leave this line
    // out, Meteor will never consider the subscription ready because
    // it thinks you're using the added/changed/removed interface where
    // you have to explicitly call this.ready().
    return [];
  }
});
As explained in this comment
this.ready() is more straight forward than an empty array
1 Like
@waldgeist did you try to debug client side sub with meteor dev extension for Chrome? It’ll tell you about ddp messages, local collection size. Maybe you receive a huge initial batch of documents?
Where are you locate db for staging and prod? At the same DC with app?
Do you use any proxy like nginx?
Yes, I did. On the staging system, the data comes in steadily, while on the prod system it comes in chunks, with long delays inbetween.
Yes, that’s correct (if 6k small documents is huge), but this is exactly the same on both systems. Also, if I zoom into the map, the number of documents gets reduced drastically, but the problem still appears if I pan around (only a handful of docs will be changed in this case). On the staging system, the data comes in almost instantly (if panning around the map), while on the prod system it takes ages.
Both at Mongo DB Atlas. Staging uses the free tier, while prod uses a paid tier. Otherwise, they are identical.
No, because it’s two different providers (AWS vs. Mongo DB), but that’s also the same in both cases.
EDIT: It actually does run in the same datacenter at AWS. Forgot that I deployed the ATLAS cluster there.
Yes, on both systems. I am deploying with mup.
1 Like
Any chance of an index issue? Were you able to rule out that this is not a db issue?
Indexes are the same, since the SimpleSchema definitions are the same. Also the stats on Atlas looked pretty much the same. In Monti APM, I couldn’t find a way to see the database query time for pubs. But for methods, they are neglectable, as you can see in the first images above.
The problem seems to be caused by the immense “wait times” in the pubs.
I do not know this. Is there a way to automate the db index using SimpleSchema? We have to manually do this on a per query basis
It’s actually part of Collection2, which extends SimpleSchema (both by aldeed):
2 Likes
Thanks. Learning a number of things from this thread 
I unblocked my pubs now, but this resulted in a noticeable performance degradation.
For a test-case, I zoomed into my map, waited until it has been rendered, and then zoomed out again. Without the unblock, the rendering of the larger view-port takes about 2.3s, but with the unblock, it takes 2.8s, sometimes even over 3s.
I also deployed this version to the prod system. But nothing changed. The problem still persists, the app is barely usable.
CORRECTION: It’s in fact a bit better now on the prod system. The initial wait times are gone:
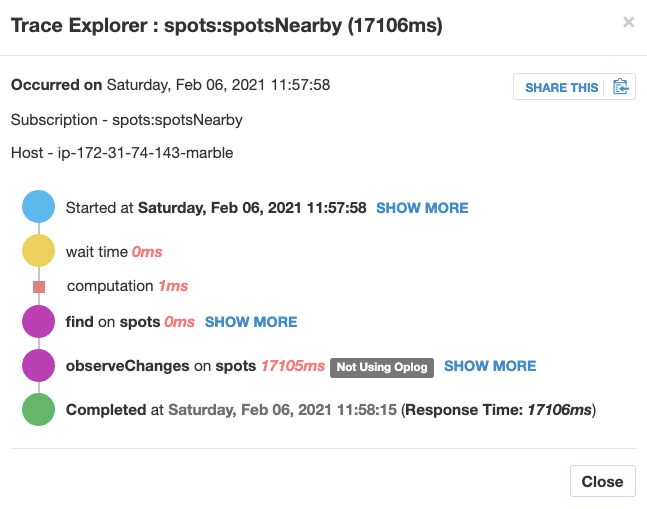
But still it takes much, much longer than on the staging system until the actual content is being rendered (this is what made me believe the sub did not return). The same operation, which takes 2s on the staging system, takes 12s - 16s on the prod system. Same code base. And it doesn’t really explain why the staging system did not show these problems in the first place, even without unblocks.
The same query on the staging system looks like this:
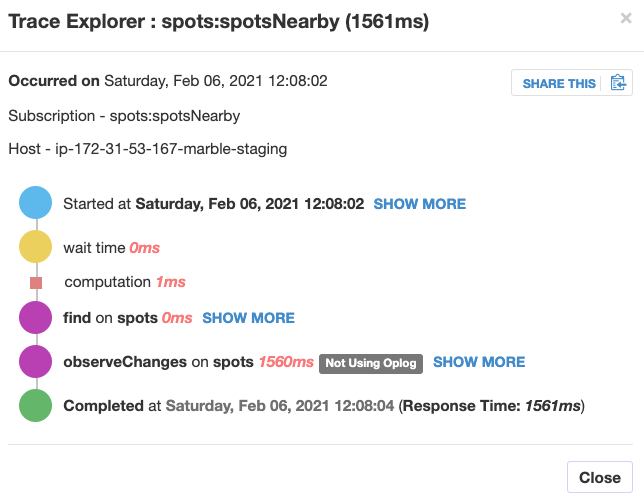
That’s a factor 10 in oplog wait time (17.1s vs. 1.5s), which explains the huge delay. For the same amount of data. The staging database is a 1:1 copy of the prod database, copied with 3T Studio.
1 Like
Ok. I temporarily connected my staging system to the Mongo DB cluster of the prod system. And voilà, it showed the same problems. Seems as if the Atlas cluster is the actual culprit. Now I have to find out how to restart that thing.