I need help with application performance monitoring. I’m more interested in understanding performance from our user’s perspective (as opposed to server resource monitoring). How quickly are the pages loading? How can I know this? We are using Google Analytics Site Speed reports, but how do Page Timings related to websocket traffic?
I believe we are losing sales due to periodic sluggish performance, but I’m not sure how to measure this? Ideally I’d like some kind of page performance monitor which will email me when performance is poor so I can add more Galaxy containers or something.
Kadira tracks pub/sub timings, but I feel like that’s an incomplete picture of the user experience.
Can anyone share how they manage to deal with these issues?
We are hosting on Galaxy if it matters.
We’ve tried Pingdom but it seems too unreliable due to issues with their PhantomJS configuration or something
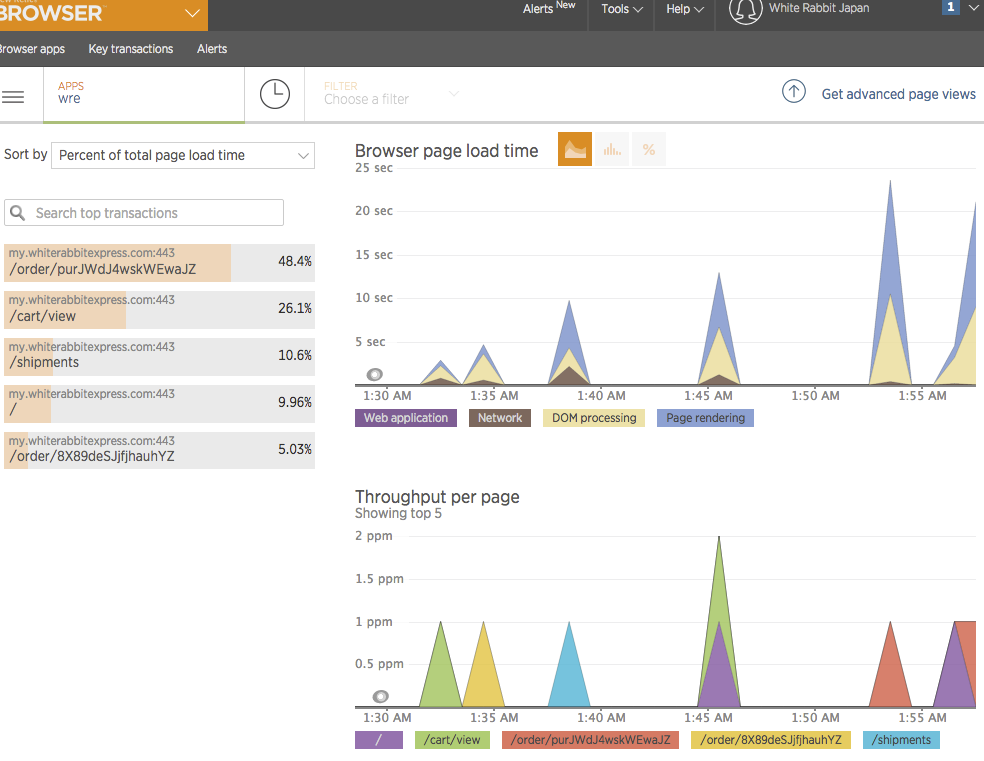
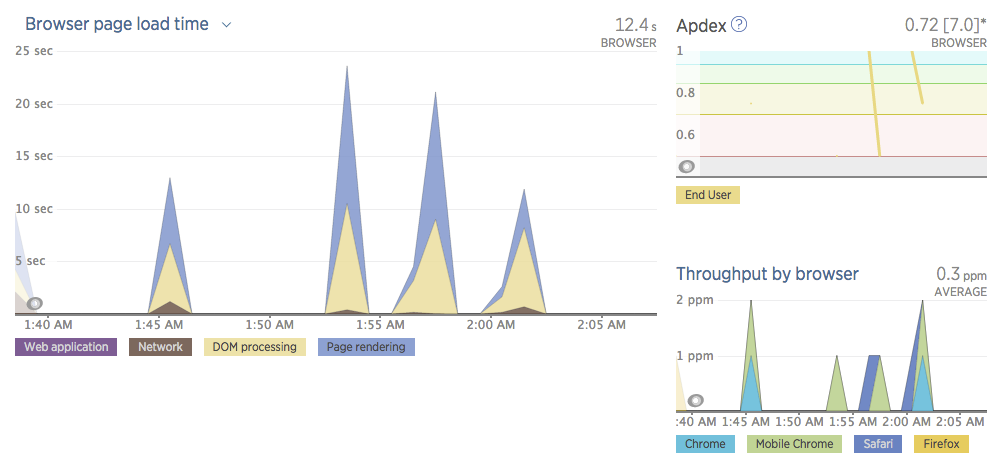
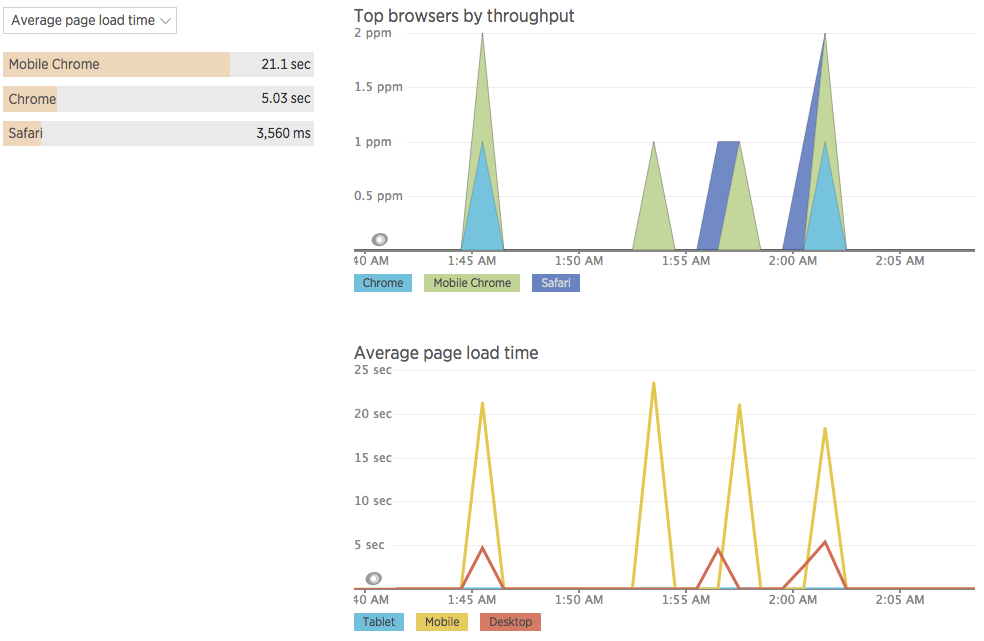
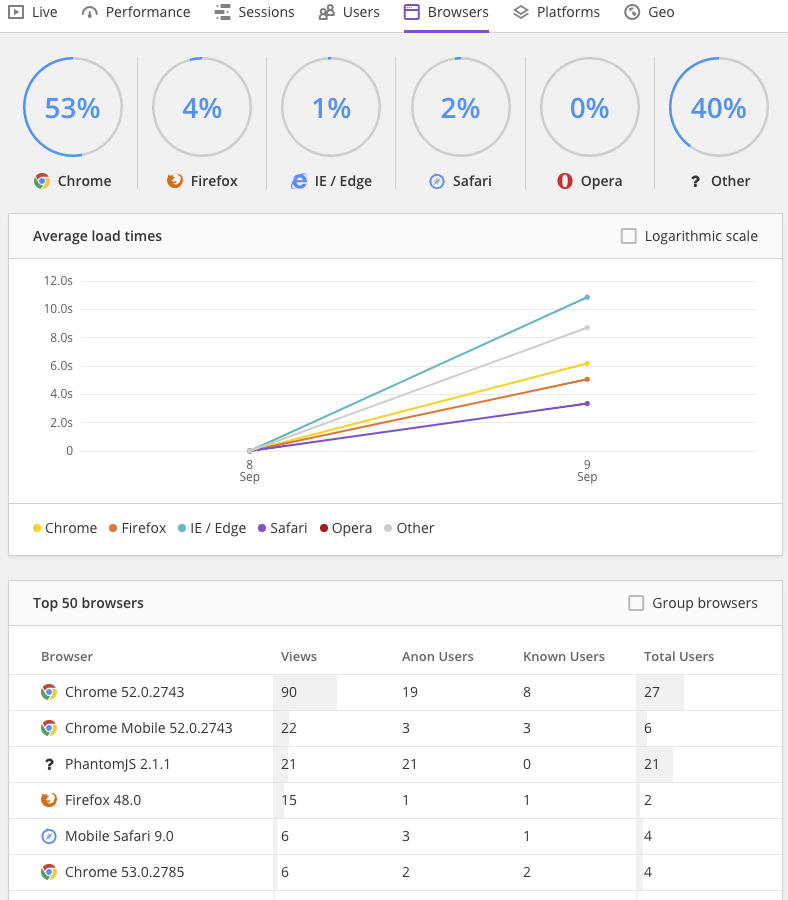
I setup both Raygun Pulse (real user monitoring) and New Relic Browser. The Raygun Pulse UI design is really outstanding. I find it much easier to understand and to navigate the data using their dashboard than New Relic Browser NRB. It’s much less intuitive to know how to interpret the NBR charts. It seems NBR is more throughput-centric–rpm (requests per minute); and, ppm (pages per minute) than aggregate values.
Granted they’ve only been activated for a couple hours, so I have very little data
Overall Raygun Pulse seems like a much more well thought out product regarding their data visualization choices.
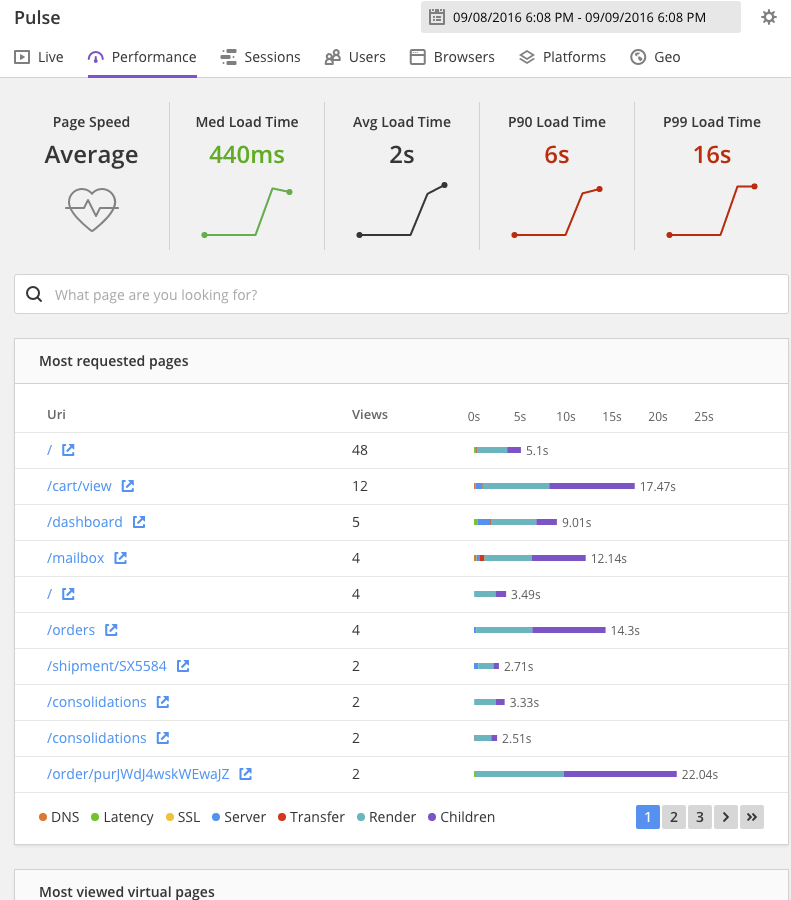
So, are my users frustrated?
One thing I’m seeing is slow asset loading, which sounds like a call for CDN. We never got around to configuring a CDN because it seems a bit complicated, but now maybe we should make the time to work through those issues.
Let’s wait a few days, because we really need more sessions to have an accurate picture.
Thanks for taking the time to post these screenshots, great seeing what these services look like especially on a Meteor site.
Re static assets, yeah, CDN is the way to go, but an interim move is usually to offload the serving of static assets from Meteor/nodejs to nginx (which improves app performance too, of course). It would be great if Galaxy does that for you but I’m not really sure, especially since it requires care as to the cache time for the various different assets. But if you’re ready to make the move to CDN, you must as well skip this interim step :>
I’m not really a devOps guy, so pardon the dumb questions. If we are hosting on Galaxy can we even use nginx? That’s something you’d install if you were managing your own server right? Or does one host the app at Galaxy then put up the assets on a second, Digital Ocean machines running ngnix or something?
Oh sorry I wasn’t very clear. As far as I know, Galaxy uses nginx (other servers can do the same thing too), so maybe they give you some options for this via the UI or do it automatically for limited time in /public… I dunno. It was just a thought; I don’t use Galaxy, could be worth finding out. But as said, nothing beats a real CDN.
OK so with Raygun “crash” reporting, how you figured out anyway to get actionable info? Because of minification and lack of source maps for production, it’s useless. How are we suppose to deal with Meteor app errors without sourcemaps?
@maxhodges I, too, am very interested in getting RUM data from users on our Meteor app. Kadira and GA (and most of the legacy RUM tools) don’t really provide the full picture for single page apps.
Have you tried New Relic Browser’s new Single Page App agent (vs their older, generic, navigation timing based agent)? They claim automatic instrumentation of “Route Changes” by hooking into the History API, but I’ve been unable get any captures. I’m using Iron Router which does some unholy things with Tracker and setTimeout under the hood, so I’m not too surprised it’s not working. And even if it does end up working, it’s clearly built with AJAX applications in mind, not DDP/Websocket apps.
re CDNs: We’re fronting our Meteor app on Galaxy with Amazon Cloudfront. We have a client side helper to rewrite all urls for assets (mostly images, but also async loaded css/js) with the CDN hostname. The CDN is configured to fetch cache misses from our production app servers running on Galaxy. After some initial hiccups with css caching bugs in an earlier version of Meteor it’s worked very well.
Most likely you are, it just depends on what percentage is significant. Google had a stat where 53% of mobile traffic gives up after 3 seconds of loading without content!
The best tool i’ve came across is Web Page Test. You can run it through various browsers and it will spew out a lot of great data with advice on the lowest hanging fruit.
Sometimes the initial page load time can be skewed with websockets but it has a video recording mode with timestamps (advanced tab) so you can play it back and see exactly how many seconds X takes to be on screen. You can also emulate a slower mobile connection in the advanced tab.
Also this book is a great read, even though it’s a bit older. Steve is actually the one who recommended this site at a local Meetup… I think he helped work on it.
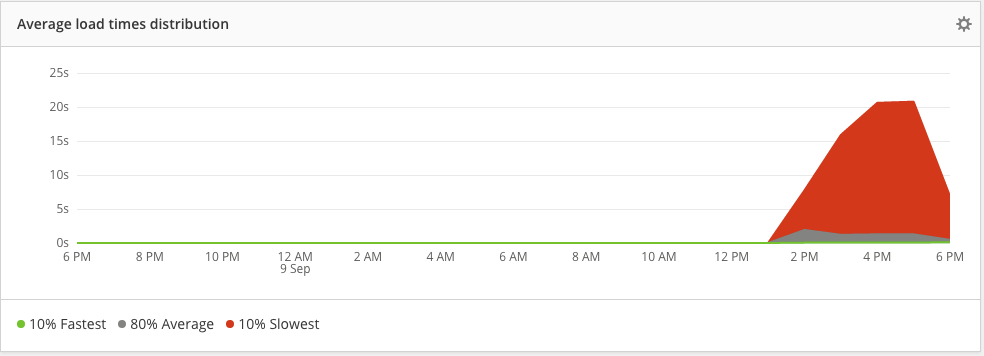
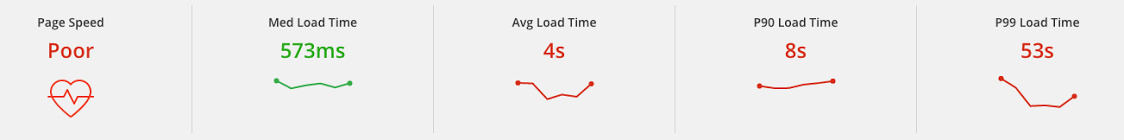
Given how drastically the median and the average differ, it stands to reason that there are some pretty strong outliers. I wish I could know more about those outliers. I wish I could see the distribution of page load times as a graph, and also be able to filter that graph by adding/removing countries, ISPs, or even users based on analytics traits:
How is page load speed affecting new/returning customers?
How is page load speed affecting our biggest customers?
How is page load speed affecting our biggest market (In our case, US/Australia/Singapore customers)
Is page load speed a function of country? distance?
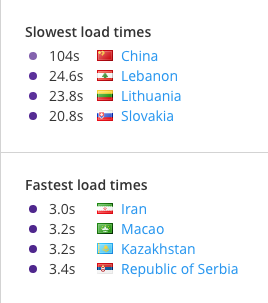
The answers to these questions can give us insights into whether the problem is on our end, or our customers’ ends. Maybe it’s a page issue, or maybe we just need to spin up an Asian server because it’s a region issue, or maybe it’s an issue with our customer that is out of our control. It’s unfortunate that we can’t see a list of all countries, ranked by load-time:
We get almost no orders from these countries. Aside from the fact that I’m surprised that people from Kazakhstan have such fast internet, it doesn’t help us much. Maybe even a graph over time would be useful, to see if certain countries are improving or not
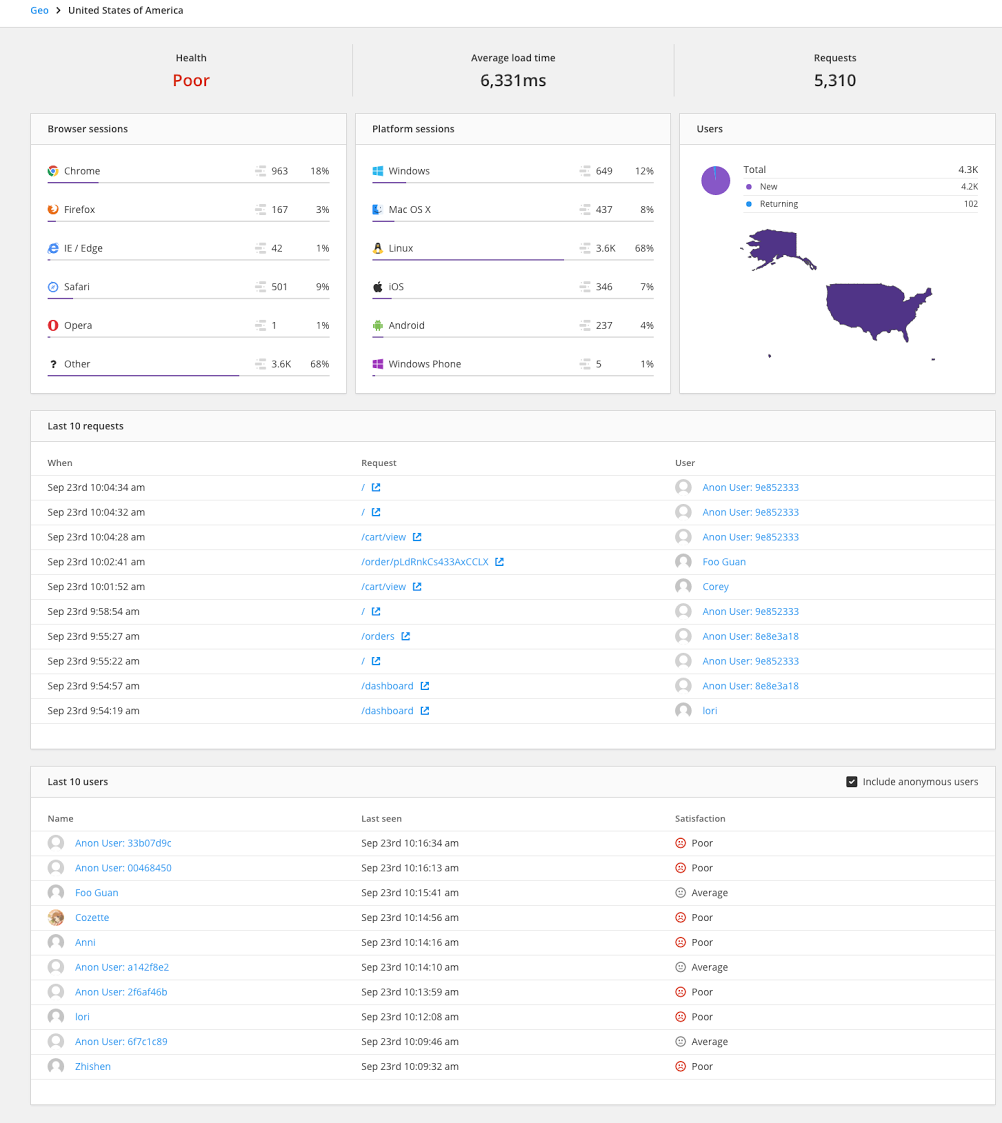
Here is are the details for our biggest market, the US:
I really wish I could see a distribution of all page-load times, and a distribution of per-user average page-load times.
Is any slowness just because of a few users, or is it endemic to all users in the US?
Is it limited to a specific region or regions?
ISPs?
Which pages are affecting these users the most?
Almost none of the information on this page is actually helpful to me in identifying and correcting speed-related problems.
Their reply
Hi Jeremy,
Thanks for raising these issues. Regarding the documentation, these can certainly be clarified a bit which I will ensure is done for you. For your specific questions:
Those metrics are human-readable calculated versions of the Browser PerformanceTiming data we receive for every request (PerformanceTiming - Web APIs | MDN). Latency is defined as connectEnd - connectStart, e.g the time it took for the transport layer to open it connection (and depends on network quality and can show degradation at the lower layers). Server is the time it took for the request to be computed on the server minus all in-flight network time.
In general Pulse surfaces data from the Browser Timing API. We currently cannot surface websockets to any acceptable detail as this data is not provided by the browser vendors. If they do surface it we will capture and pass it through. Futhermore and for the other supported assets, long running events will not disrupt latency/server as the former only concerns network conditions and the latter concerns calculated server time for a particular request.
Render time concerns what the browser records as the pageLoad event time, e.g DOMContentLoaded (when visual components are displayed to the user and the page’s state is ‘complete’ and ready for interaction. If a webpage contains scripts that have an SPA app lifecycle, this use case is not particularly well understood by the browser timing API. In this instance we offer virtual pages to track page load events, and are planning to support custom timing data and custom events in future to support the SPA use case.
Children will only include child assets that load prior and around DOMComplete, so long-running Ajax calls won’t be considered for the Children metric. These will however be captured and surfaced on the waterfall and in other components e.g Most Requested XHRs.
Thanks for your feedback on the users and sessions components, that is useful. If you wanted to add a feature request for the additional filtering/sorting at Feature requests for Raygun. | Raygun that will help as we use that to prioritise upcoming work.
Specificly for your use cases mentioned at the bottom, we are aware of these pain points and are conducting research into increasing the flexibility of Pulse and adding more data and tools that can surface that data and answer those questions intuitively.
It’s not going to be identical to a real device but you can simulate 3g connections with various 3g speeds, mobile browsers, etc…
In the Silicon Valley area (Palo Alto). That meetup was in San Francisco hosted by Airbnb (they have monthly tech talks). There’s more meetups than time to go to them unfortunately! The GraphQL summit is coming up soon
So envious, I was offered a job out their once many years back, should have made the move. The GraphQL conf is only one day, can’t justify the flight for that. The next time there’s a multi-day conf, give me a heads up and I’ll make the jump.