Chart with c3.js is not reactive with DB data!

Hello,

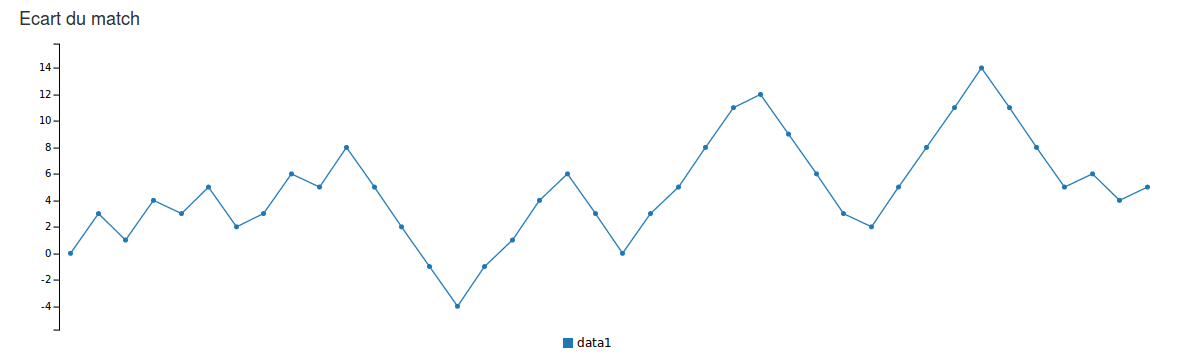
I made a chart with c3.js :

And this is the code to render it :

Template.summary.rendered = function() {
  var self = this;
  var chart = c3.generate({
    bindto: this.find('#gameGapChart'),
    data: {
        xs: {
            'data1': 'x'
        },
        columns: [
            ['data1']
        ]
    },
    axis: {
        x: {
            show: false
        }
    }
  });

  this.autorun(function(tracker) {
    var gameData = self.data.gameStats.evolution;
    var xArray = ['x'];
    var yArray = ['data1'];
    for (var i = 0; i < gameData.length; i++) {
      xArray.push(gameData[i][0]);
      yArray.push(gameData[i][1]);
    }
    chart.load({
      columns: [
        xArray,
        yArray, []
      ]
    });
  });
};

self.data.gameStats.evolution is the data available in the Template in the form :

"gameStats" : {
  ...
  "evolution" : [ 
    [0, 0],
    [1, 3],
    [2, 1],
    [3, 4],
    [4, 3],
    ...
  ]
...
}

The first value is the xAxis value and the second is for the yAxis value.

I can’t make the chart dynamic in the way that everytime gameStats.evolution got a new value the chart update. Right now, I need the refresh the page to see the chart been updated.

Can somebody help me make the chart dynamic via the database and not the Session variable.

Thanks in advance.

Take a look through this repository:

It uses NVD3, but many of the patterns will be the same!

1 Like

Hi @awatson1978,

Thanks for the repo but the fact to only have one chart by page is a no go for me because, I’ll display many stats via different charts on a single page.

Is there any way to pass the data object to the graph via an helper or something else ?

Put as many graphs on the page as you want. I’ve made dashboards with a half dozen reactive graphs all from the same data collection and/or config record.

The example is less about page layout as it is getting database reactivity. You’re making a mistake putting things in onRendered. Make a separate function for your graph, and and put it in both your route and a resize helper. The relevant function in the example is dailyInteractionsLineGraph()

2 Likes

Thanks for the great and clear examples @awatson1978! It is tempting to put things in onRendered() as the default answer, especially with wrapping it in autorun, but a helper works great (in my experiments anyhow) in many situations.