CPU spikes every 10 min due to accounts-base package

I have a single combined meteor server and MongoDB (I know, but it works for now!), and precicely every 10 minutes I see a CPU spike:

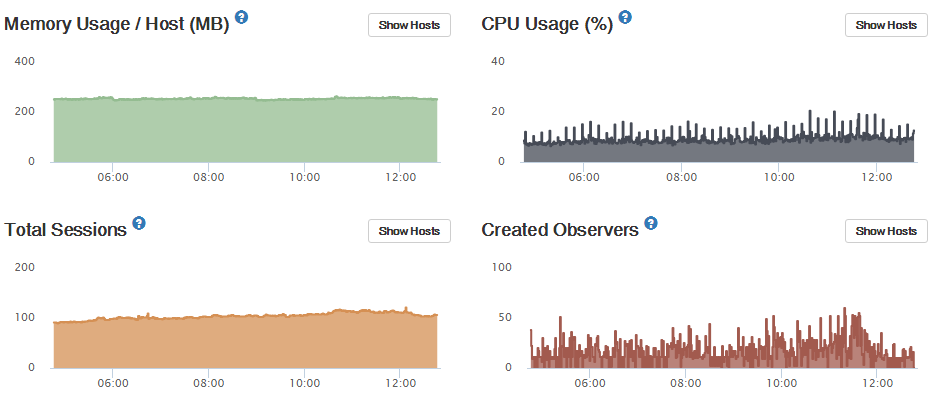
It’s not new but unfortunately I don’t know when I started seeing this. I’ve only just got around to investigating.

I’ve tracked it down to the following code in accounts-base/accounts_server.js:

const setExpireTokensInterval = accounts => {
  accounts.expireTokenInterval = Meteor.setInterval(() => {
    accounts._expireTokens();
    accounts._expirePasswordResetTokens();
    accounts._expirePasswordEnrollTokens();
  }, EXPIRE_TOKENS_INTERVAL_MS);
};

I’ve proved this code is the culprit by changing EXPIRE_TOKENS_INTERVAL_MS to 15 minutes instead of 10 minutes and the spikes change accordingly.

To see how long this code is taking and how many tokens are removed I modified the code to:

const setExpireTokensInterval = accounts => {
  accounts.expireTokenInterval = Meteor.setInterval(() => {
    const a0 = new Date().valueOf();
    const r1 = accounts._expireTokens(); // I've hacked this to return the number of records updated
    const a1 = new Date().valueOf();
    const r2 = accounts._expirePasswordResetTokens(); // I've hacked this to return the number of records updated
    const a2 = new Date().valueOf();
    const r3 = accounts._expirePasswordEnrollTokens(); // I've hacked this to return the number of records updated
    const a3 = new Date().valueOf();
    console.log('expire tokens:', a1-a0, a2-a1, a3-a2, 'total='+(a3-a0), 'removed:', r1, r2, r3);
  }, EXPIRE_TOKENS_INTERVAL_MS);
};

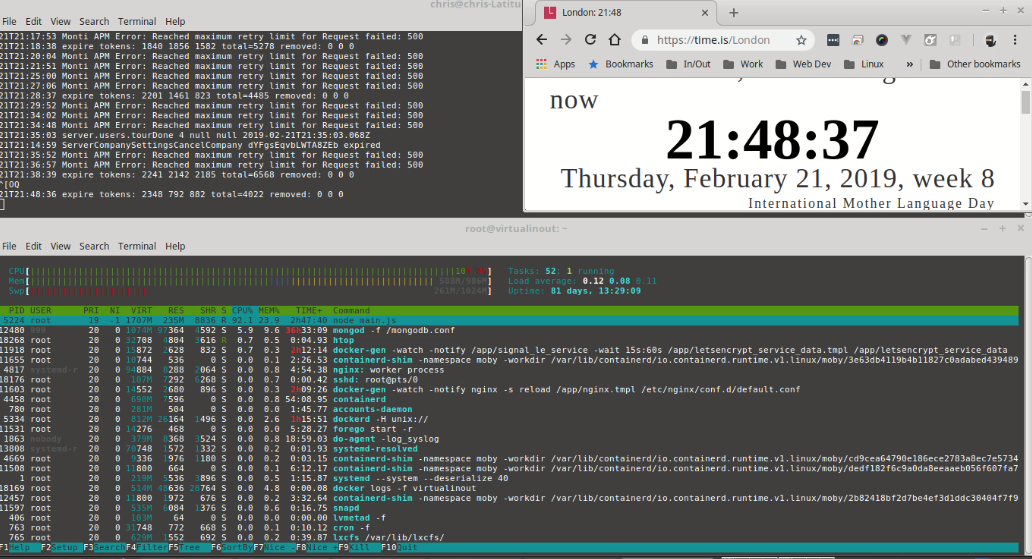
This gives the following output:

20T22:48:37 expire tokens: 2825 447 1268 total=4540 removed: 0 0 0
20T22:58:38 expire tokens: 2572 630 2109 total=5311 removed: 0 0 0
20T23:08:37 expire tokens: 2810 1461 387 total=4658 removed: 0 0 0
20T23:18:36 expire tokens: 2132 784 519 total=3435 removed: 0 0 0
20T23:28:36 expire tokens: 2322 694 471 total=3487 removed: 0 0 0
20T23:38:36 expire tokens: 2280 1354 384 total=4018 removed: 0 0 0
...

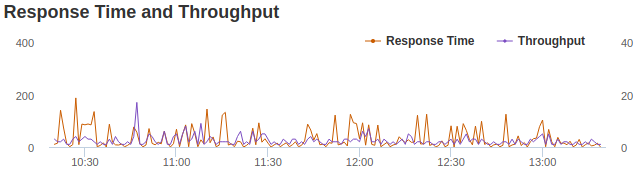
Why is this taking so long even though no tokens are being deleted - I’ve seen some instances up to 7 seconds?! The execution time seems to increase during the afternoon (US time) when demand is highest

accounts._expireTokens() seems to be the worst offender of the three.

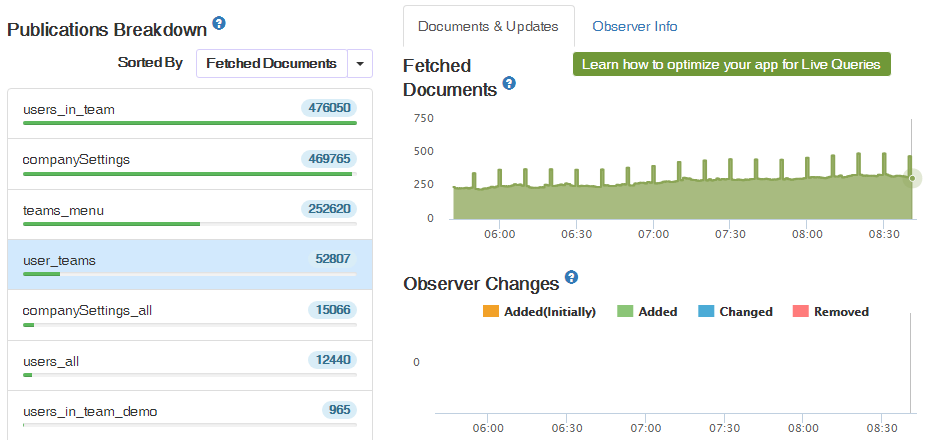
My users collection only contains 946 users, and 407 of these contain “services.resume.loginTokens.when”, but none of those tokens are over 90 days old. However, most of them contain multiple loginTokens.

When I run a similar query direct in the mongo shell using .explain("executionTime") it takes only a couple of milliseconds and seems to be using an index.

I guess my questions are:

  • Why are these queries taking so long?
  • Since no records are being updated, it can’t be to do with the Oplog or an observer on the users collection, could it?
  • Is the reported execution time the actual time taken for the query, or is the this.users.update() running asynchronously so other stuff might be happening in another fiber at the same time?
  • Would there be any downside to pushing EXPIRE_TOKENS_INTERVAL_MS out to an hour or once a day?

Thanks!

3 Likes

Interesting investigation.

With that setup, maybe you need to isolate which process is causing this CPU spike?

Could you please share the charts/data that made you conclude this method is taking long time (up to 7s) ? I don’t see this data in your post, did I miss something?

Hi @alawi, thanks for showing an interest.

Watching htop during one of these events, definitely node spikes a lot and mongo didn’t seem to change much at all. The server is relatively quiet at the moment though so it’s only 1-2 seconds and is over within a couple of htop updates. I’ll keep an eye on it tomorrow when it takes 4-6 seconds… Is there a better method than watching top/htop?

The 7s came from yesterday’s console.log messages similar to the above but where the "total=" was over 7000ms. Unfortunately I didn’t save yesterday’s log output.

1 Like

I use htop as well… not sure if there is something better…

Ah yes, you’re summing the durations, sorry I should I’ve looked closer. It is puzzling why those calls are taking that long, but it could be that they are yielding to another fiber when the DB queries are hitting so maybe they’re not really taking that long…not sure how to verify that though, maybe more console logs before/after it yields…

Here’s the % CPU usage for node and and mongo during one of these updates (I recorded a screencast, then played it back slowly):

Total time taken for this instance was 4.8 seconds. The previous one was 6.5 seconds:

My hacked version of _expireTokens() to return the number of user records updated is:

  _expireTokens(oldestValidDate, userId) {
    const tokenLifetimeMs = this._getTokenLifetimeMs();

    // when calling from a test with extra arguments, you must specify both!
    if ((oldestValidDate && !userId) || (!oldestValidDate && userId)) {
      throw new Error("Bad test. Must specify both oldestValidDate and userId.");
    }

    oldestValidDate = oldestValidDate ||
      (new Date(new Date() - tokenLifetimeMs));
    const userFilter = userId ? {_id: userId} : {};


    // Backwards compatible with older versions of meteor that stored login token
    // timestamps as numbers.
    return this.users.update({ ...userFilter,
      $or: [
        { "services.resume.loginTokens.when": { $lt: oldestValidDate } },
        { "services.resume.loginTokens.when": { $lt: +oldestValidDate } }
      ]
    }, {
      $pull: {
        "services.resume.loginTokens": {
          $or: [
            { when: { $lt: oldestValidDate } },
            { when: { $lt: +oldestValidDate } }
          ]
        }
      }
    }, { multi: true });
    // The observe on Meteor.users will take care of closing connections for
    // expired tokens.
  };

Literally all I’ve added is the “return”.

_getTokenLifetimeMs() is trivial, so nothing else is going on in this function which can contribute to the reported time taken. Therefore I think you’re right, the DB query must be yielding to another fiber, but odd that whatever else is going on seems to take a long time at exactly this moment.

So on to plan B - is there any downside to pushing EXPIRE_TOKENS_INTERVAL_MS out to an hour, or a day?

1 Like

Some users will use their token beyond its lifespan? I guess for your setup, the tradeoff might worth it…

The default lifespans are multiples of days, accounts-base/accounts_common.js#L307:

// how long (in days) until a login token expires
const DEFAULT_LOGIN_EXPIRATION_DAYS = 90;
// how long (in days) until reset password token expires
const DEFAULT_PASSWORD_RESET_TOKEN_EXPIRATION_DAYS = 3;
// how long (in days) until enrol password token expires
const DEFAULT_PASSWORD_ENROLL_TOKEN_EXPIRATION_DAYS = 30;

So an extra day wont hurt. Checking every 10 minutes seems excessive to me, but maybe the Meteor devs had their reasons…

Fortunately the setInterval handle is exposed as Accounts.expireTokenInterval and the expire functions are exposed as Accounts._expire....(), so I can easily clear the default interval and create my own daily interval in my own code without having to maintain a copy of the accounts-base package.

Still, it would be good to know what’s causing the CPU usage but I’m at a loss how to dig any further into it.

Is it worth reporting as an issue on github?

1 Like

Yeah I think so, perf is usually taken seriously
(When backed up with data like yours that is)

Reported here:

3 Likes

There’s nothing in the meteor code that I could find that would cause a CPU usage spike doing this.

I would just caution that hosts like the one you’re using are incredibly slow. What is the actual “hardware” your server is running on?

AWS burstable instances in particular can behave super wonky.

Also, I see elsewhere that you said:

What can be worse, if you store lots of data on the user object (like I do) then using Meteor.user() on the server can be a very expensive db operation when often only a single field is required.

So if you’ve been hacking around that and did something wrong, or if you store a lot of data in the services field, then yes, it will be unusually slow for you.

Hi @doctorpangloss, thanks for showing an interest.

My host is a single Digital Ocean droplet, 1 GB RAM, 25 GB Disk, Ubuntu 18.04 x64. Not sure what the CPU is. All my other queries and methods run very efficiently:

responsetime

It’s only this expiring tokens function and its 3 queries which takes a long time, even when there are no tokens to expire.

Yes, I store some custom data in the Users database, but I don’t touch the services field - I’ve no reason to. The biggest field is a “log” field where I store an array of objects which after being live for a couple of years with daily activity can be quite large for some users, but this field is never published and only very rarely queried in a method (so it doesn’t have an index).

If it’s of any use/interest, here’s my db.users().stats(): { "ns" : "virtualinout.users", "size" : 4176589, "count" : 936, "avgObjS - Pastebin.com

Running the same token expiry queries directly in the mongo shell takes only a couple of ms, so I think it must be either another Fiber doing something while Meteor waits for the async mongo queries to return, or maybe a delay in the communication between meteor and mongo?

Is there any way I can trace what’s happening in Meteor during this period?

If storing a bunch of data on the user is contributing to the problem, perhaps @msavin’s userCache could help.

userCache builds upon three simple premises:

  • Every time you run Meteor.user() on the server, it has to call the database to retrieve the user document
  • Every time a user account connects to your server, Meteor automatically subscribes for to their user document
  • Whenever a subscription is running, the documents that are part of that subscription are cached to the server

Thus, instead of querying the database every time that Meteor.user() is ran, we could first see if it’s sufficient to retrieve it from the server-side cache (also known as MergeBox). Since MergeBox is fast and real-time (in fact, it gets the data before the client), the risk of stale data may be insignificant.

Thanks @colinf. I wasn’t aware of userCache, but I love @msavin’s Jobs package so will check it out.

I’m aware of some of the pitfalls of storing data on the user object and lazy use of Meteor.user() causing expensive db ops. As described in my other recent post here I’ve already patched Meteor.user() to report and help eliminate that problem. I suppose I should also track down any instances of Meteor.users.find/findOne() without any field limiters which could be fetching more data than necessary.

However, I’m pretty sure that my data on the user object isn’t contributing to this problem. Supposedly the only db ops happening during the expireTokenInterval is the removal of login tokens over a certain age. The removal takes a long time regardless even if no old tokens are found/removed, which leads me to believe that something else is going on.

I need to try to copy my production db to localhost and see if I can re-create the CPU spikes locally, then I’ll be able to remove all my own data from the user object and see if it makes a difference…

Something you could try to do is clone out your virtual machine, and let it run, without users, and then see what happens. You’d just have to run it for an hour.

  • If it’s related to a lot of users being connected concurrently, you won’t see the spike. That eliminates most node / fibers / mongo driver code and most meteor code EXCEPT ddp-server, crossbar and Meteor.setTimeout. So we know it’ll be there.
  • If it is related to a lot of users being connected concurrently, you will see a spike. That eliminates most meteor code, and would indicate something wonky with node / fibers / the mongo driver.

Great idea, I’ll try that as well. I just need to make sure the clone is incapable of sending any scheduled emails/sms/push notifications or taking automatic subscription payments :wink: . I’ll report back when I’ve had time to try that, may not be for a couple of days… I could also test different Meteor releases too.

Come to think of it, do you have anything that does Meteor.users.find().observeChanges()?

That’s your culprit!

I’ve cloned my production db on my local machine and also a staging server identical to production. Neither exhibit the same spikes and the expireTokens interval only takes 20-150ms total. So it only appears to be a problem when users are connected (production server varies between 50-100 concurrent sessions, spikes are worse when there are more active sessions).

I don’t have any of my own users.find().observe or users.find().observeChanges(). I’ve search the compiled server bundle and there’s one in accounts.base but nothing else obvious.

However, as shown in my OP, the operation takes several seconds even when no tokens are removed ("...total=5311 removed: 0 0 0"), so I don’t think it can be an observer or a publication.

Meteor does auto publish user data and logged in users auto subscribe that publication. If you store bunch of data in user collection that would cause the problem. I’m not sure about this.

Yes, but (assuming you’ve removed autopublish) the default publish only includes the profile, username and emails fields, so none of my custom user data is published to the client unless I specifically publish it. I do publish some of my custom data, but the “log” field which is the biggest is never published. I only ever extract small parts of the log via a method.

Besides, as I’ve said, the expire tokens functions take a long time even when no tokens are removed, so that pretty much rules out a publication or observer because nothing is changing.

I’ve just discovered (via montiapm) that one of my publications is also spiking every 10 minutes coinciding with the token expiry setInterval.

My user_teams publication is where I send all my custom user data to logged in users, and looks like this:

Meteor.publish("user_teams", function() {
	if (this.userId) {
		const result = Meteor.users.find(this.userId, {fields: {
			teams: 1,
			teamAdmin: 1,
			view: 1,
			set: 1,
			superAdmin: 1,
			"profile.name": 1,
			userTour: 1,
			hideHeader: 1,
			loneWorkerAccepted: 1,
			isLoneWorker: 1,
			loneWorker: 1,
			loneWorkerHistory: 1,	// keep this separate so can send all of loneWorker to other users.
			commsOptOut: 1,
			devices: 1,
			"mobile.number": 1,
			"mobile.verified": 1,
			notifications: 1,		// a list of unacknowledged notifications
			showConsole: 1,
		} });
		// console.log("meteor.publish user_teams", JSON.stringify(result.fetch()));
		return result;
	}
	return [] ;

None of these fields are being changed during the token removal updates (nothing is being changed because most of time no old tokens are found to expire).

So why would this publication be re-running for lots of users after the token expiry query?

I’m using peerlibrary:reactive-publish by @mitar, but this publication isn’t using an autorun.