My app is connected to 2 databases with oplog tailing enabled for both connections. The secondary connection is using maxfi:remote-collection@0.3.0 to create the connection.
Every 30 mins throughout the day external services do an ETL to update the secondary database from a third-party service. Usually there’s less than 500 documents inserted/updated/removed, except for one aggregation that has an $out stage that outputs about 30,000 documents. There’s also another ETL process that updates one document approx every second.
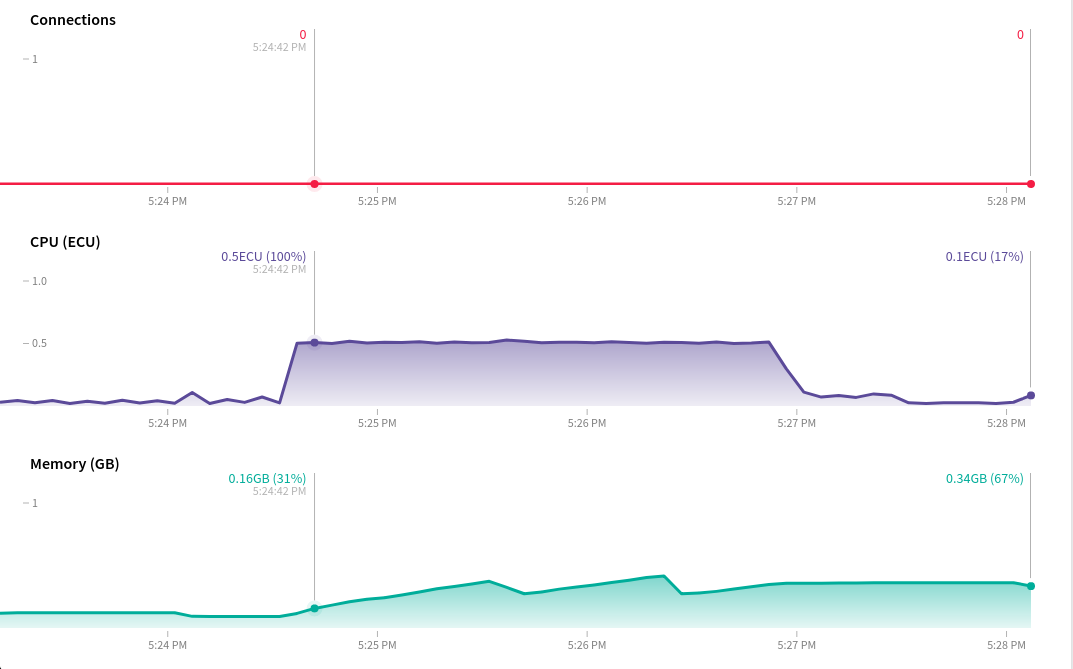
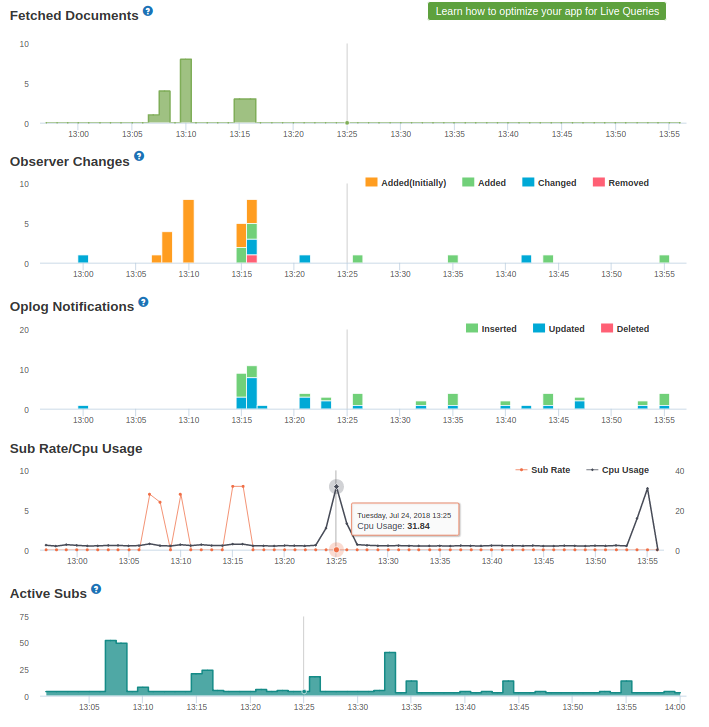
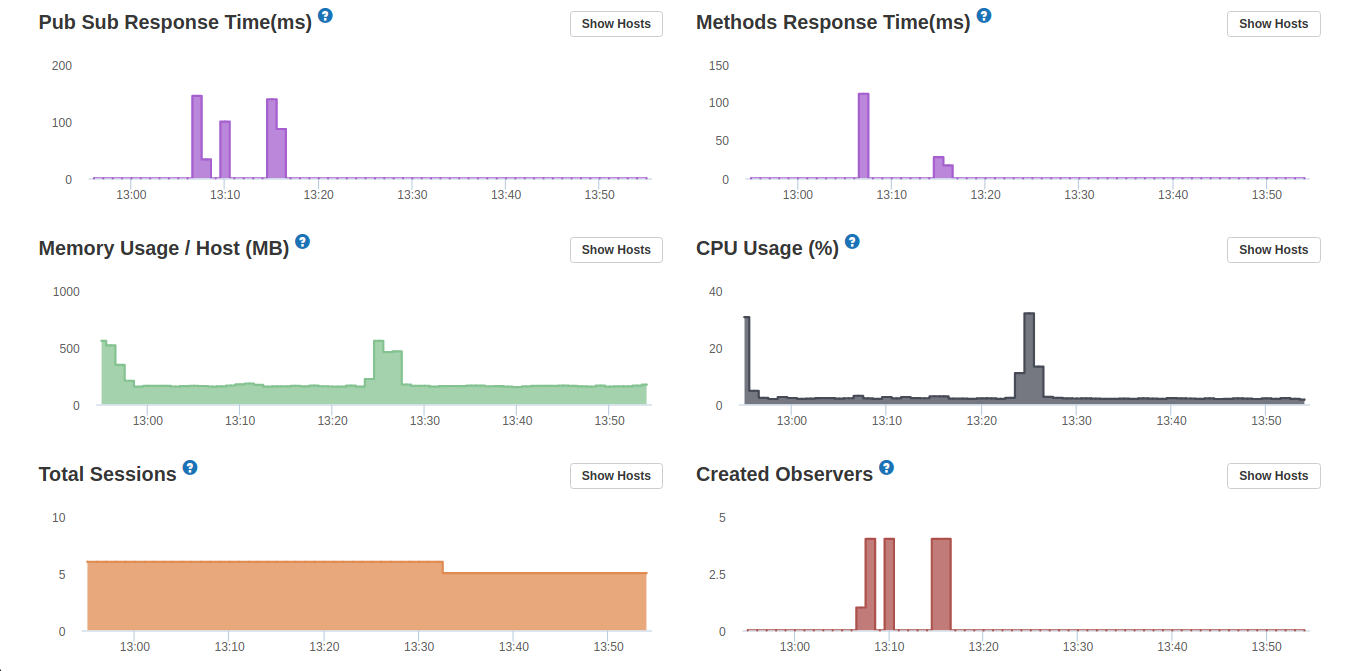
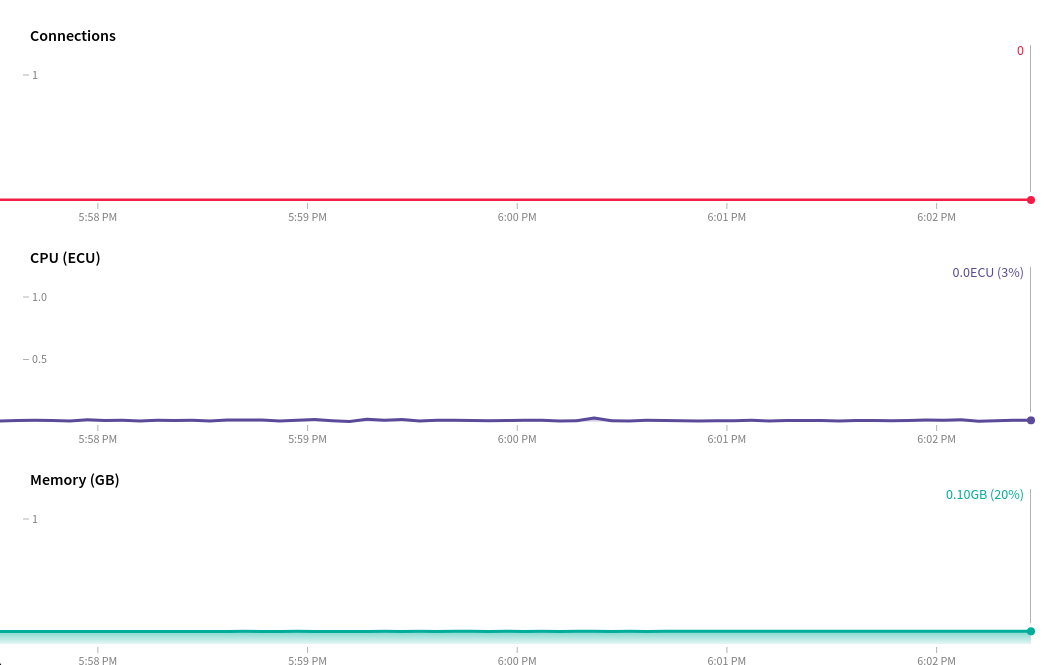
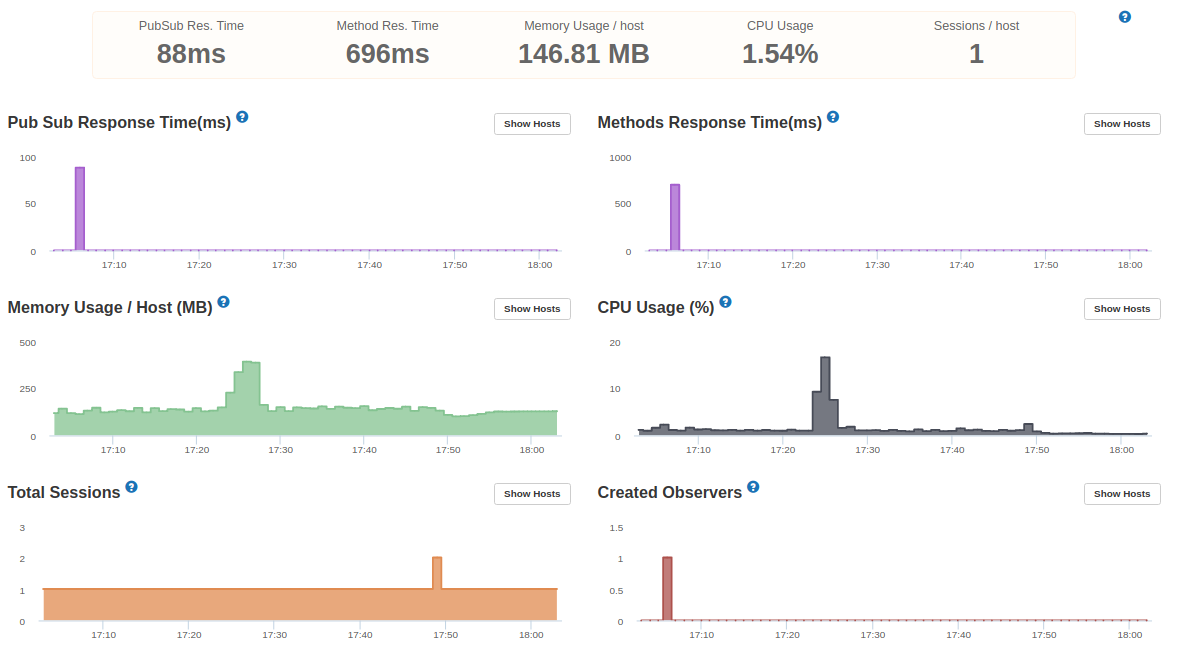
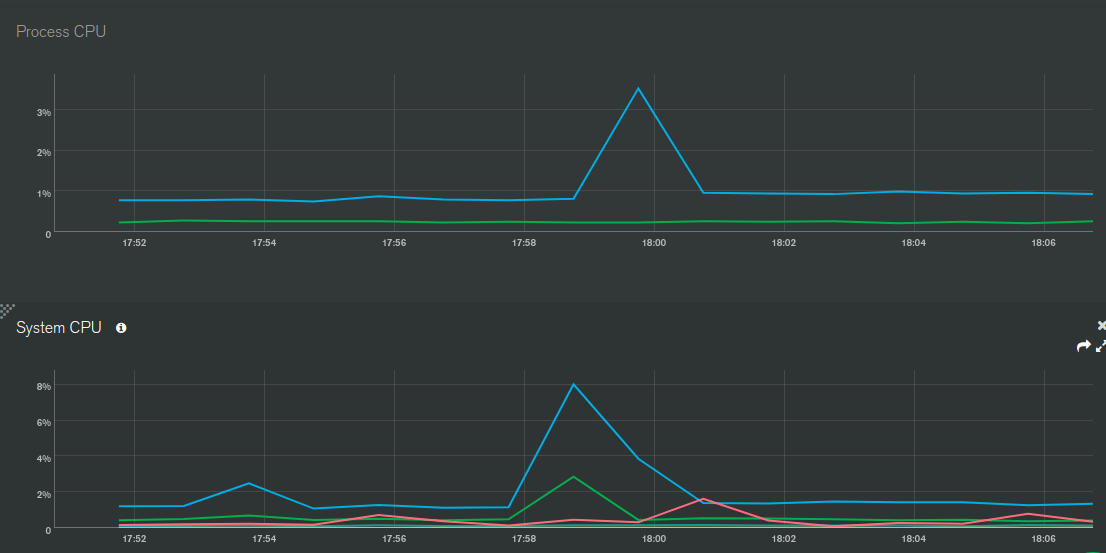
The issue is that, with oplog tailing enabled on the secondary database connection, the meteor apps CPU starts thrashing for almost 3 minutes. The strange thing is that the app doesn’t even publish or observe the large aggregations output collection, which I assume could otherwise be a problem, and as far as I’m aware meteor doesn’t create oplog notifications for $out aggregations anyway… The other db updates seem minimal enough that meteor shouldn’t freak out. Furthermore, I can’t see any oplog notifications or observer changes in the APM.
I’ve tested the ETL with oplog tailing disabled on the secondary collection and the issue appears to be resolved. However, I’m wondering what’s going on here and why the CPU thrashing occurs with oplog tailing enabled, even though the app isn’t observing most of the updates. Any insights would be greatly appreciated!
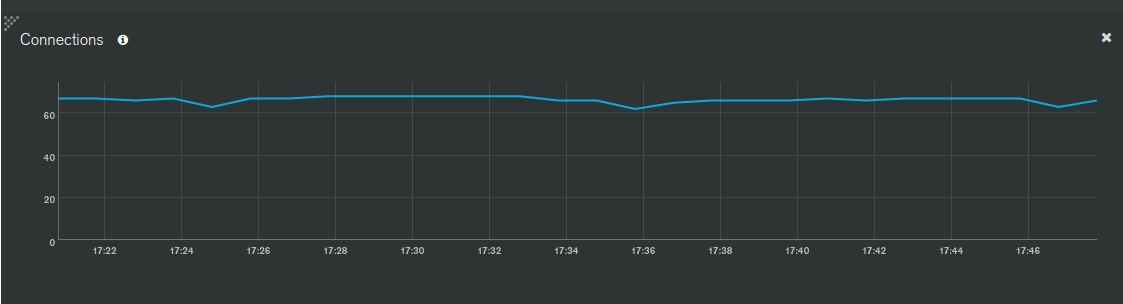
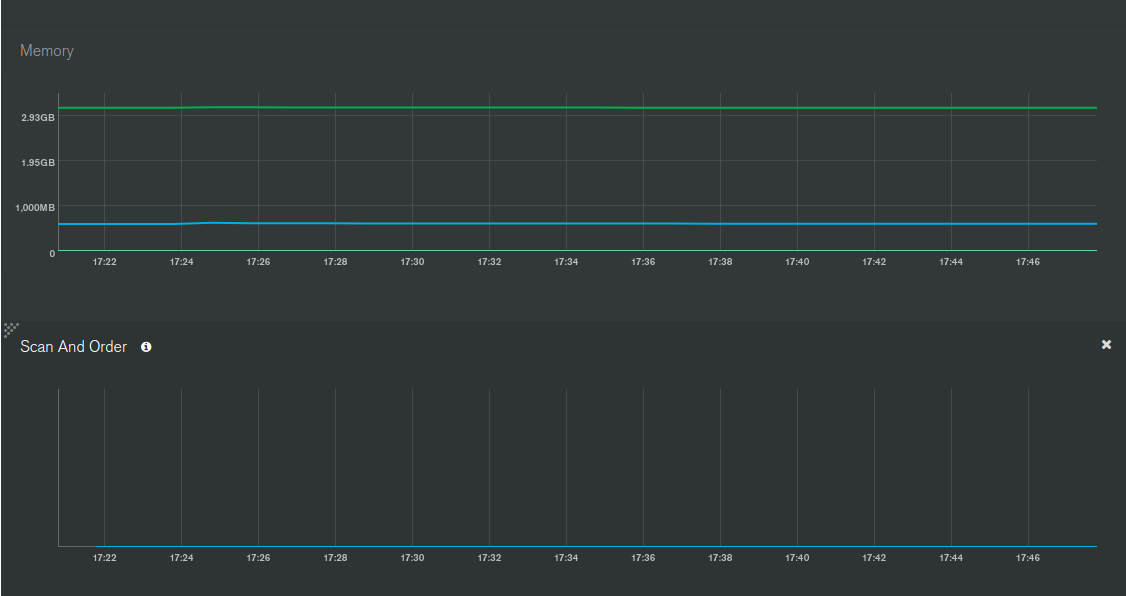
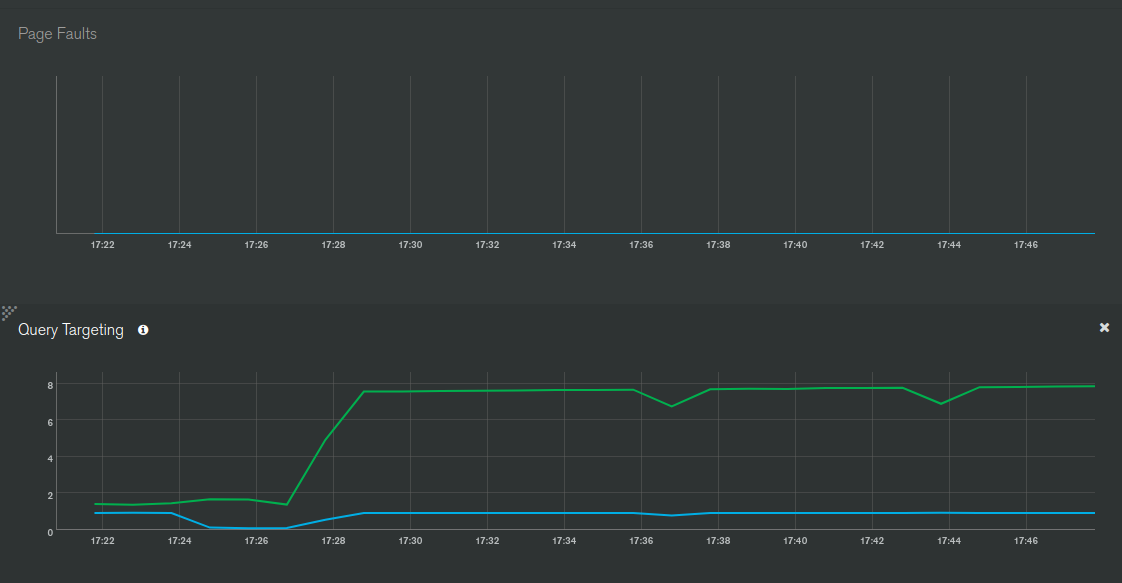
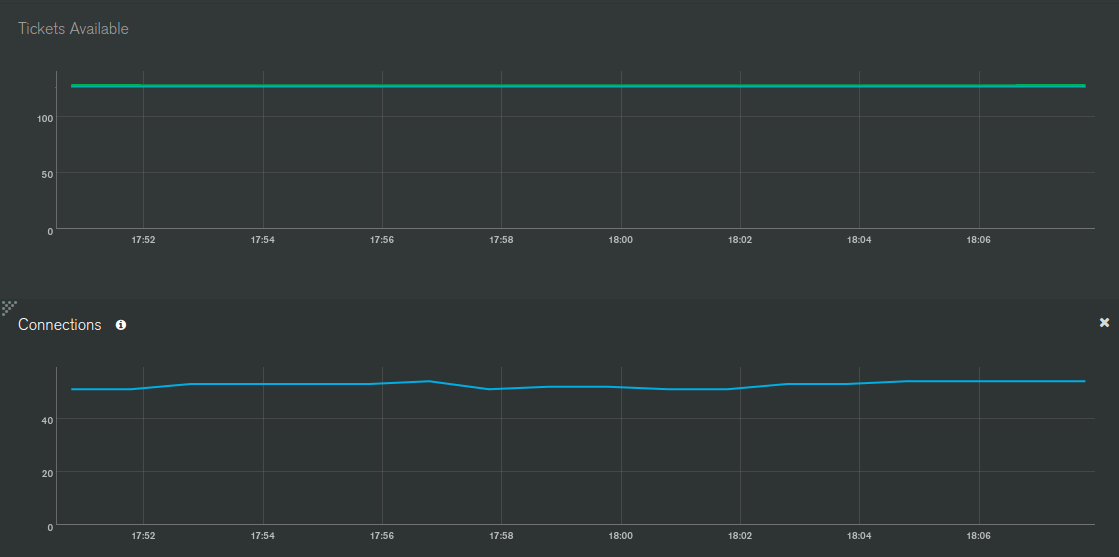
Below are some screenshots from Galaxy, APM and MongoDB Atlas as well as some more info about the infrastructure and the app.
Meteor is simply tailing the oplog, so the server would get notified for all operations. Subsequently, Meteor decides which observers are affected by these operations.
It seems that while there are no observers in your case that would be affected by the batch operations, the number of oplog entries created by the batch operations are enough to overwhelm the Node.js process. While this hasn’t been a problem in my setup, a lot depends on the cpu power available to your Node.js process. Also, maybe you are missing some Observers that are getting affected by these operations? It has happened to me earlier
Architecturally it makes sense to separate the “reactive” and “non-reactive” collections like you’ve done to avoid the problem. The other option would be to use something like redis-oplog for your app’s reactive updates instead of Mongo oplog.
I would be surprised if $out doesn’t create oplog notifications; doing aggregations via $out writes the result to a special read-only collection.
Even if you don’t have any observes on a particular collection, for every oplog notification you are going to have the overhead of BSON deserialization and a number of EJSON.clone calls, both of which are extremely CPU intensive.
How many observes do you have on this secondary database? Disabling the oplog for the secondary database might be a reasonable solution if you don’t have many observes on that database.
Could you do the aggregation without using the $out operator? That would prevent all the oplog notifications coming in.
I guess that makes sense that it would need to translate oplog entries to EJSON to know if any observers are affected by those operations.
As far as I can tell I only have 3 observers (publications) on the secondary database. However, they are for small collections with minimal changes. If I have missed some, would this show in APM under “Oplog Notifications” or “Observer Changes”?
What I could perhaps do instead of using the $out stage is to take the aggregation result and diff it with what’s already in the database, as the data doesn’t change much, and then only insert/update/remove as required. Perhaps it’s possible to use the same diff algorithm that meteor uses in it’s PollingObserveDriver? This would, however, increase load on the server currently running the aggregation but that shouldn’t be an issue in my particular setup.
On a more general note, how would one generally diagnose this type of issue? I would have expected APM to show a large number of oplog notifications, or does it only show oplog notifications for observers? How would one debug this on galaxy?
For now, having disabled the oplog on the secondary connection appears to have resolved the issue. However, I’d love to get a better understanding of this to avoid this type of issue in the future.
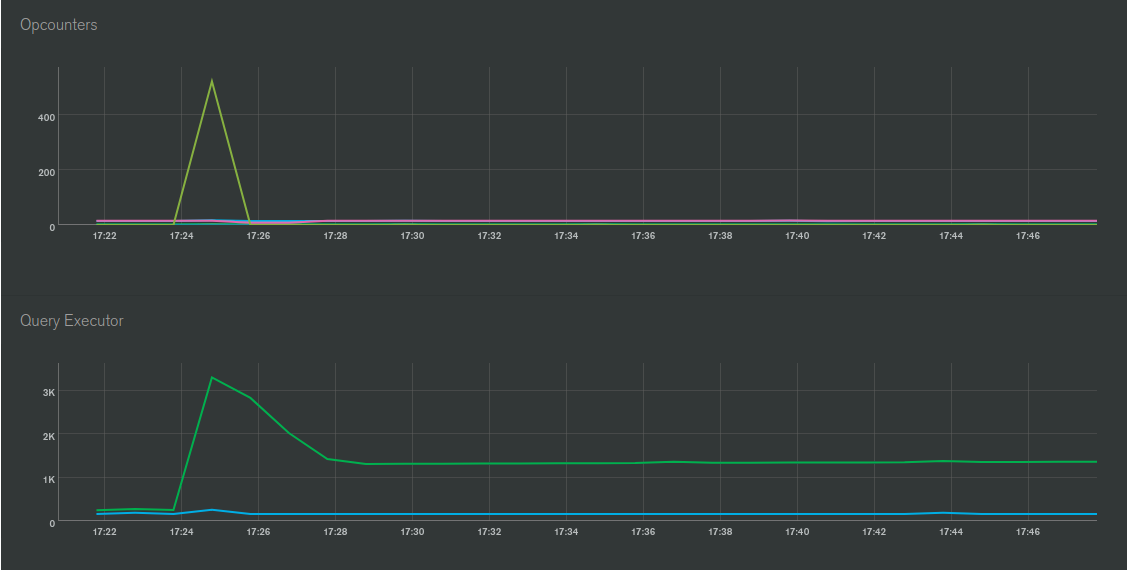
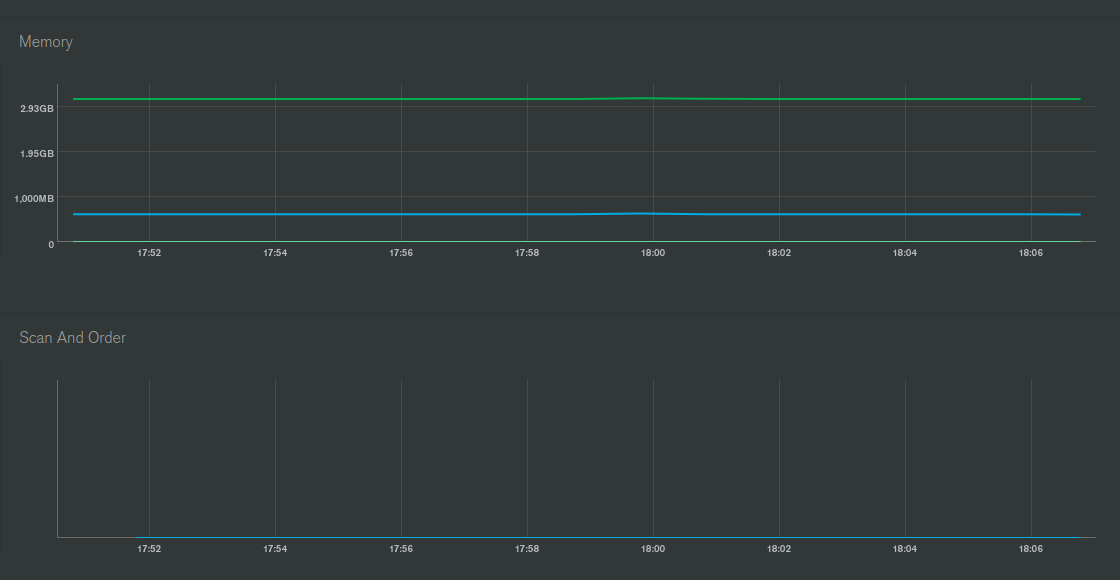
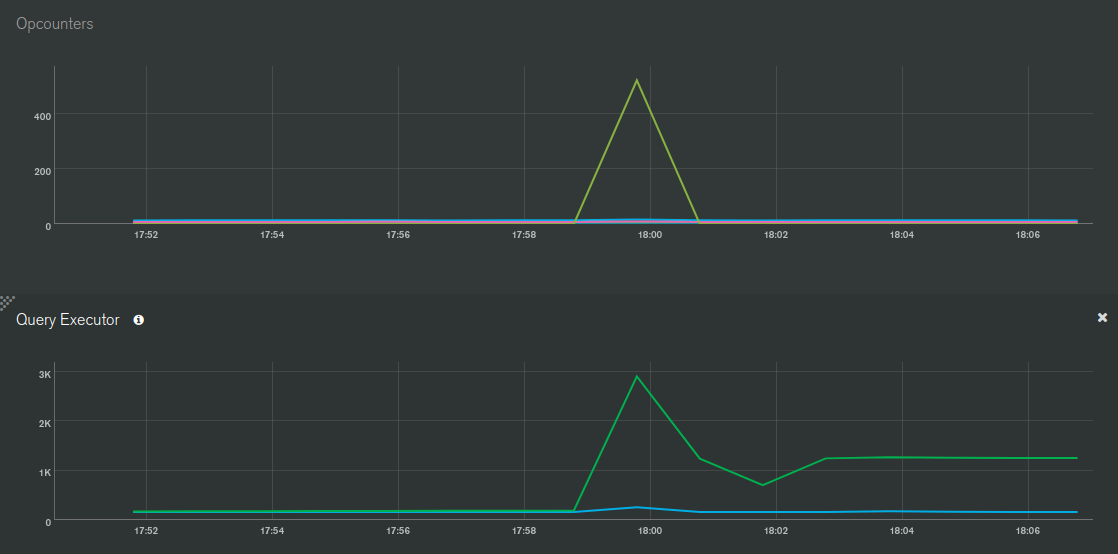
On a side note, would the increase in the “scanned objects” (green line) and continued higher levels be due to the $out stage writes?
That question reminded me that Kadira’s documentation had a section on this. Turns out that those docs are now available in Galaxy’s guide: Optimizing Your Meteor App for Live Queries | Galaxy Docs (section ‘Prevent unwanted oplog notifications’). It seems to be addressing a scenario very similar to yours, and also recommends separating the databases like you’ve done.
The guide suggests that if the trend of “Oplog Notifications” doesn’t match the trend of “Observer Changes”, then there are oplog notifications not needed by the app (the ones that account for the difference), and hence can be moved to a non-oplog database. So conversely, if their trends match then the app has Observers that are getting affected by oplog notifications. I think you should be able to see such Observers in the ‘Publications Breakdown’ section
Definitely feels like disabling oplog tailing is the way to go here. If you want to double check how many observes you have that are currently using the oplog vs polling driver, check out https://github.com/qualialabs/analyze-observes
If you take this approach, then I don’t think you will have to change any of your code; relying on $out in this case seems totally fine.
I expect that the bump in scanned objects is likely to rerunning the aggregation. Does that bump coincide with rerunning the aggregation?
And Kadira does not show all oplog notifications. In fact, it doesn’t even display oplog notifications for all observes. It only shows oplog notifications associated with publications.