Data in highchart

ok now i try this through foreach loop

      string res="[";
        var mdata = new TrackDataEntities1().spsumdata(RegNo)
        .Select(s => new { month = s.Month}).ToArray();
        foreach (var c in mdata)
        {
          res += "'" + c.month + "',";
      
        }
        res = res.Substring(0, res.Length - 1);
        res += "]";          
        return Newtonsoft.Json.JsonConvert.SerializeObject(res);

and i got this

['August','July','June','May']

but when i implement in chart like this

<script type="text/javascript">
        $(function () {

            $('#tabledata').on('click', 'tr', function () {
                var row = $(this);
                var regno = row.find('td')[0].firstChild.data;
                var obj = {};
                obj.RegNo = regno;
                Getsumdata(obj);
                return false;

            });
        });
        function Getsumdata(obj) {
            $.ajax({
                type: "POST",
                url: "WebForm1.aspx/summarydata",
                data: JSON.stringify(obj),
                contentType: "application/json;charset=utf-8",
                dataType: "json",
                async: true,
                cache: false,
                success: function (response) { 
                    alert(JSON.stringify(response.d));
                    var data1 = response.d.split("*")[0];                   
                    console.log(JSON.stringify(response.d));
                    alert(data1);

                        $('#sumdata').highcharts({
                            title: {
                                text: 'Combination chart'
                            },
                            xAxis: {
                                categories: data1
                            },
                            labels: {
                                items: [{
                                    html: 'Total fruit consumption',
                                    style: {
                                        left: '50px',
                                        top: '18px',
                                        color: (Highcharts.theme && Highcharts.theme.textColor) || 'black'
                                    }
                                }]
                            },
                            series: [{
                                type: 'column',
                                name: 'Jane',
                                data: [3, 2, 1, 3, 4]
                            }, {
                                type: 'column',
                                name: 'John',
                                data: [2, 3, 5, 7, 6]
                            }, {
                                type: 'column',
                                name: 'Joe',
                                data: [4, 3, 3, 9, 0]
                            }, {
                                type: 'spline',
                                name: 'Average',
                                data: [3, 2.67, 3, 6.33, 3.33],
                                marker: {
                                    lineWidth: 2,
                                    lineColor: Highcharts.getOptions().colors[3],
                                    fillColor: 'white'
                                }
                            }, {
                                type: 'pie',
                                name: 'Total consumption',
                                data: [{
                                    name: 'Jane',
                                    y: 13,
                                    color: Highcharts.getOptions().colors[0] // Jane's color
                                }, {
                                    name: 'John',
                                    y: 23,
                                    color: Highcharts.getOptions().colors[1] // John's color
                                }, {
                                    name: 'Joe',
                                    y: 19,
                                    color: Highcharts.getOptions().colors[2] // Joe's color
                                }],
                                center: [100, 80],
                                size: 100,
                                showInLegend: false,
                                dataLabels: {
                                    enabled: false
                                }
                            }]
                        });
                }
            });
        }
    </script>

see the black box in chart


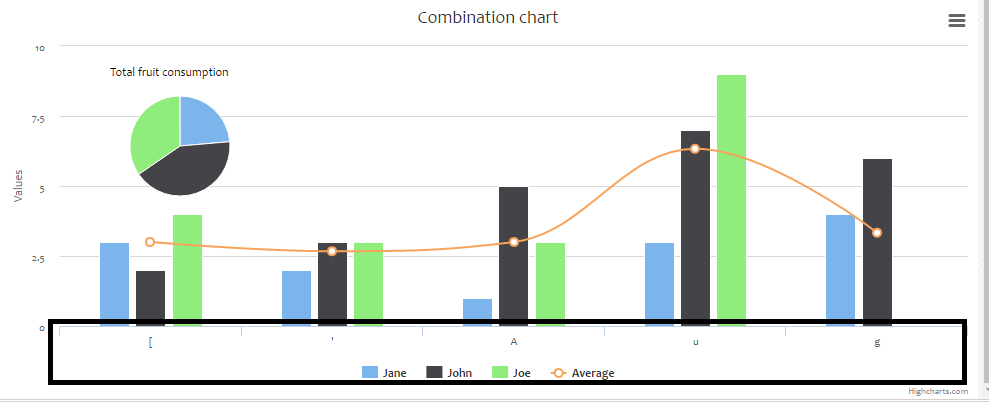
data in chart like this
so how to display months in chart ? where as i got correct json format

Are you sure you are at the correct place? Are you using Meteor?

@jhuenges check my updated question

I am still not sure that you are using Meteor :smiley:

I guess you want to have the month on the x-axis of the chart? Can you post the content of response?

@bakhtawar : are you using Meteor?

I’ve had my suspicions before now:

If you’re not using Meteor, you may find more relevant help on stackoverflow highcharts.

yes i am not using meteor i am using linq and highcharts… by the way what is meteor ? :confused:

http://www.meteor.com/

Meteor is what this forum is for discussions about.

Meteor makes it so much simpler to write web apps. You will also get better quality help, because more people will understand what you’re trying to do and be able to offer help that actually helps! :slight_smile:

so can i discuss above linq and jquery ?

I honestly think that for a general Highcharts question you would get a better response on SO.