High chart total data

I try to populate chart when user click on button … and chart is display like this now

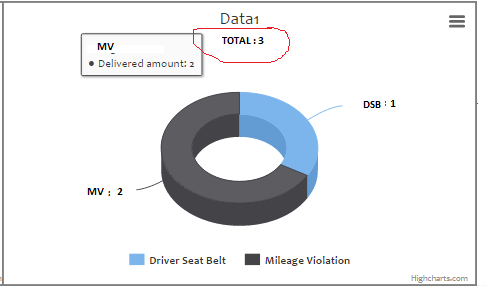
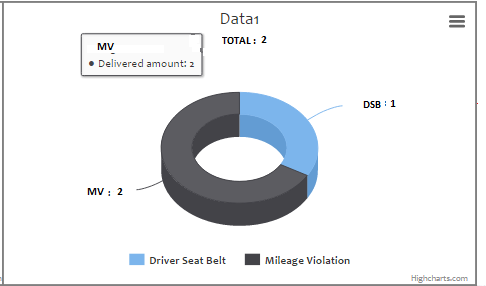
now the problem i want total i.e. as in image in red circle i write TOTAL : 3 .. 3 is beacuse 2 for MV and 1 for DSB so total is 3 I try this

this is the code which i try

    <script type="text/javascript">
    var strArray = "[['sfdsdfLi', 9],['Kiwsdfi', 3],['Mixesdfd nuts', 1],['Oranges', 6],['Grapes (bunch)', 1]]";
    $(function () {
        $('#tabledata').on('click', 'tr', function () {
            var row = $(this);
            var Id = row.find('td')[0].firstChild.data;
            var obj = {};
            obj.ID = Id;
            GetData(obj);
            return false;
        });
    });
function GetData(obj) {
    $.ajax({
        type: "POST",
        url: "WebForm1.aspx/GetVoiliations",
        data: JSON.stringify(obj),
        contentType: "application/json; charset=utf-8",
        dataType: "json",
        async: true,
        cache: false,
        success: function (result) {
            if (result !== null && result.length == 0) {
                $("#cont").hide();
                return;
            }
            strArray = result.d;
            var myarray = eval(strArray);
            $("#cont").show();
            $('#cont').highcharts({
                chart: {
                    borderColor: 'Grey',
                    borderWidth: 2,
                    type: 'pie',
                    options3d: {
                        enabled: true,
                        alpha: 45
                    }
                },
                title: {
                    text: 'Data1'
                },
             
            position: {
                    align: 'right',
                    verticalAlign: 'bottom',
                    x: 10,
                    y: -10
              },
            subtitle: {
                text: '3D Chart'
            },


            plotOptions: {
                pie: {
                    innerSize: 100,
                    depth: 45,
                    allowPointSelect: true,
                    cursor: 'pointer',
                    dataLabels: {
                        enabled: true,
                        format: '<b>{point.name}</b>: {point.y} %',
                        style: {
                            color: (Highcharts.theme && Highcharts.theme.contrastTextColor) || 'black'
                        }
                    },
                    showInLegend: true
                }
            },
                series: [{
                    name: 'Delivered amount',
                    data: myarray
                }]
            });
        },
        error: function (error) {
            alert(error);
        }

    });
        }
  </script>

NOW how i get total value ??? any solutions

Maybe use the subtitle property of the chart. You could do something like:

...
subtitle: {
  text: 'Total: ' + myarray.length
}
...

Oh and by the way, ALL CAPS is aweful.

@jhuenges whic caps???

These:

Post must be at least 20 characters

Ok I will edit my question … anyways I will try and let you know

@jhuenges when i try your code this show me like this . this show total 2 where as total value is 3…

code

      success: function (result) {
            if (result !== null && result.length == 0) {
                $("#cont").hide();
                return;
            }
            strArray = result.d;
            var myarray = eval(strArray);
            $("#cont").show();
            $('#cont').highcharts({
                chart: {         
                    borderColor: 'Grey',
                    borderWidth: 2,
                    type: 'pie',
                    options3d: {
                        enabled: true,
                        alpha: 45
                    }
                },    
                title: {
                    text: 'Data1'
                },
                
                position: {
                        align: 'right',
                        verticalAlign: 'bottom',
                        x: 10,
                        y: -10
                  },
              subtitle: {
                    text: 'Total: ' + myarray.length
                },
                plotOptions: {
                    pie: {
                        innerSize: 100,
                        depth: 45,
                        allowPointSelect: true,
                        cursor: 'pointer',
                        dataLabels: {
                            enabled: true,
                            format: '<b>{point.name}</b>: {point.y}',
                        },
                        showInLegend: true
                    }
                },
                series: [{
                    name: 'Delivered amount',
                    data: myarray
                }]
            });
    },

@robfallows will you check this

Assuming myarray is in the same format as strArray, you want something like:

text: 'Total: ' + myarray.reduce((prev, curr) => prev + curr[1], 0)

this show syntax error on =>

Do you have the ecmascript package installed (you should have)?

That code works for me.

ecmascript package?
how i install this

@robfallows ok i install EcmaScript.NET; from nuget package but this always show syntax error

No, not EcmaScript.NET. I mean Meteor’s ecmascript package. I notice none of your example code is using any ES2015 (ES6) syntax.

What is in your project’s .meteor/packages file?

in package.config

<?xml version="1.0" encoding="utf-8"?>
<packages>
  <package id="EcmaScript.Net" version="1.0.1.0" targetFramework="net40" />
  <package id="EcmaScript.Net45.Signed" version="2.0.10" targetFramework="net45" />
</packages>

I get the feeling you’re not writing this with Meteor :confused: and that it’s plain Javascript. In which case you’ll need to use ES5 syntax (reduce may not be supported across all browsers and you’ll need to code this procedurally, or use a polyfill). Vanilla ES5 syntax would be:

text: 'Total: ' + myarray.reduce(function(prev, curr) {
  return prev + curr[1];
}, 0)

this shows myarray.reduce is not a function when i check f12

so how i configure Meteor’s ecmascript package. ??

To my knowledge you don’t. Simply open the terminal/console and type ‘meteor add ecmascript’.

Can you post the content of ‘myarray’?

i try this
events: {
load: function(event) {
var total = 0;
for(var i=0, len=this.series[0].yData.length; i<len; i++){
total += this.series[0].yData[i];
}
var text = this.renderer.text(
'Total: ’ + total,
this.plotLeft,
this.plotTop - 20
).attr({
zIndex: 5
}).add()
}
},

an this work for me