Debugging 100% CPU

Hi,

Some of my servers have been experiencing extremely heavy traffic over the past week or so and I’ve struggled to debug the reason for it.

Running iftop I see the following which seems to be the root of the problem:

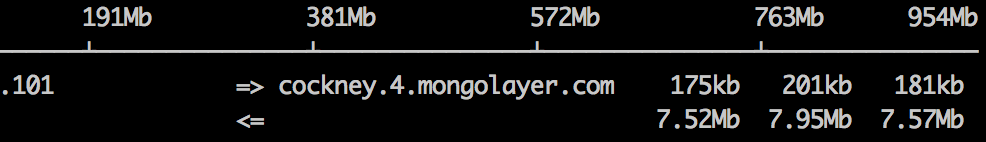
This is a server at around 60% CPU. Others are at 100%. At any given instance the server is receiving 3-12mb of data from: cockney.4.mongolayer.com (I’m using Compose for hosting).

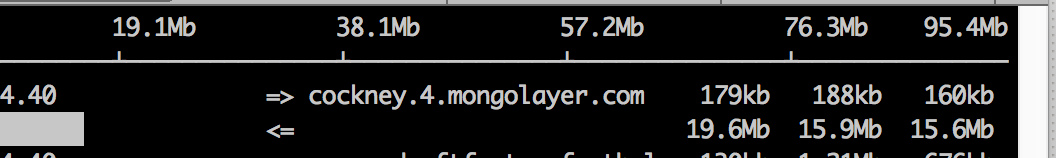
The server below is constantly at 100% CPU and is receiving 15-25mb consistently:

(Exactly the same settings for both servers. Everything about them is the same except for the IP basically).

How do I determine why is all this data is being sent and how to stop it?

Install Kadira APM to get a better overview of what your app is doing behind the scenes.

Yeah. I’ve had a look, but not been successful in understanding why some instances of the app are being flooded with data from Compose, and some aren’t. It’s the oplog that’s responsible for all this data apparently.

So seems the 100% CPU is from browsers constantly refreshing old code: