For some reason, when I open up the dev tools and try to inspect the DOM, all I see is this:

Why is this happening? Unfortunately I need to make sure IE10 works, but I’m not even able to inspect the DOM for some odd reason.
For some reason, when I open up the dev tools and try to inspect the DOM, all I see is this:
Why is this happening? Unfortunately I need to make sure IE10 works, but I’m not even able to inspect the DOM for some odd reason.
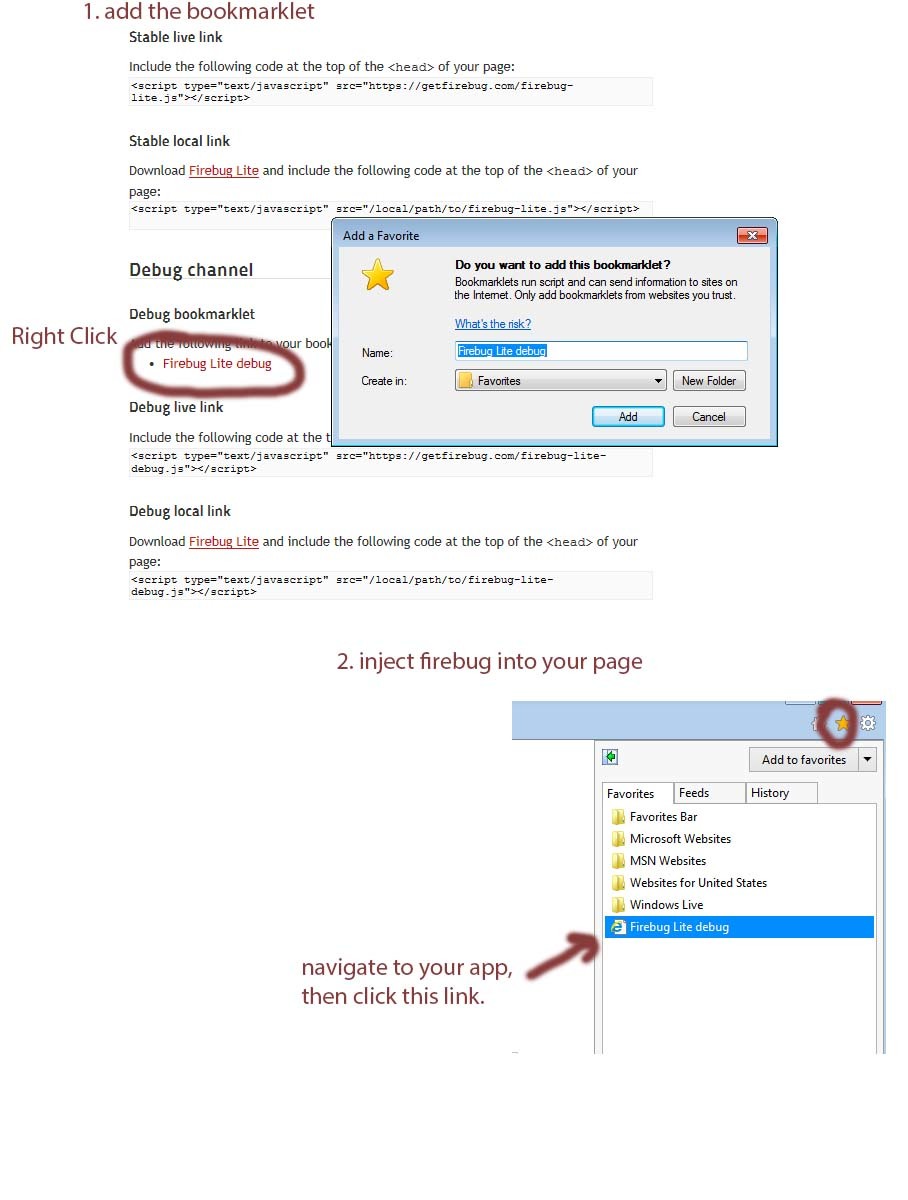
for older versions of IE, I found firebug to be a little more useful for debugging. firebug will display the contents of dom nodes. I don’t know why IE10 dev tools do not.
firebug is unintuitive to install in IE10, if you want to try it here’s the method I used :
Cool, very helpful, thanks!! Much better than IE10’s built-in dev tools. Just too bad you can’t edit styles on the fly, though… but we do what we can.