Any guess what is causing this behavior, or how to stop it?
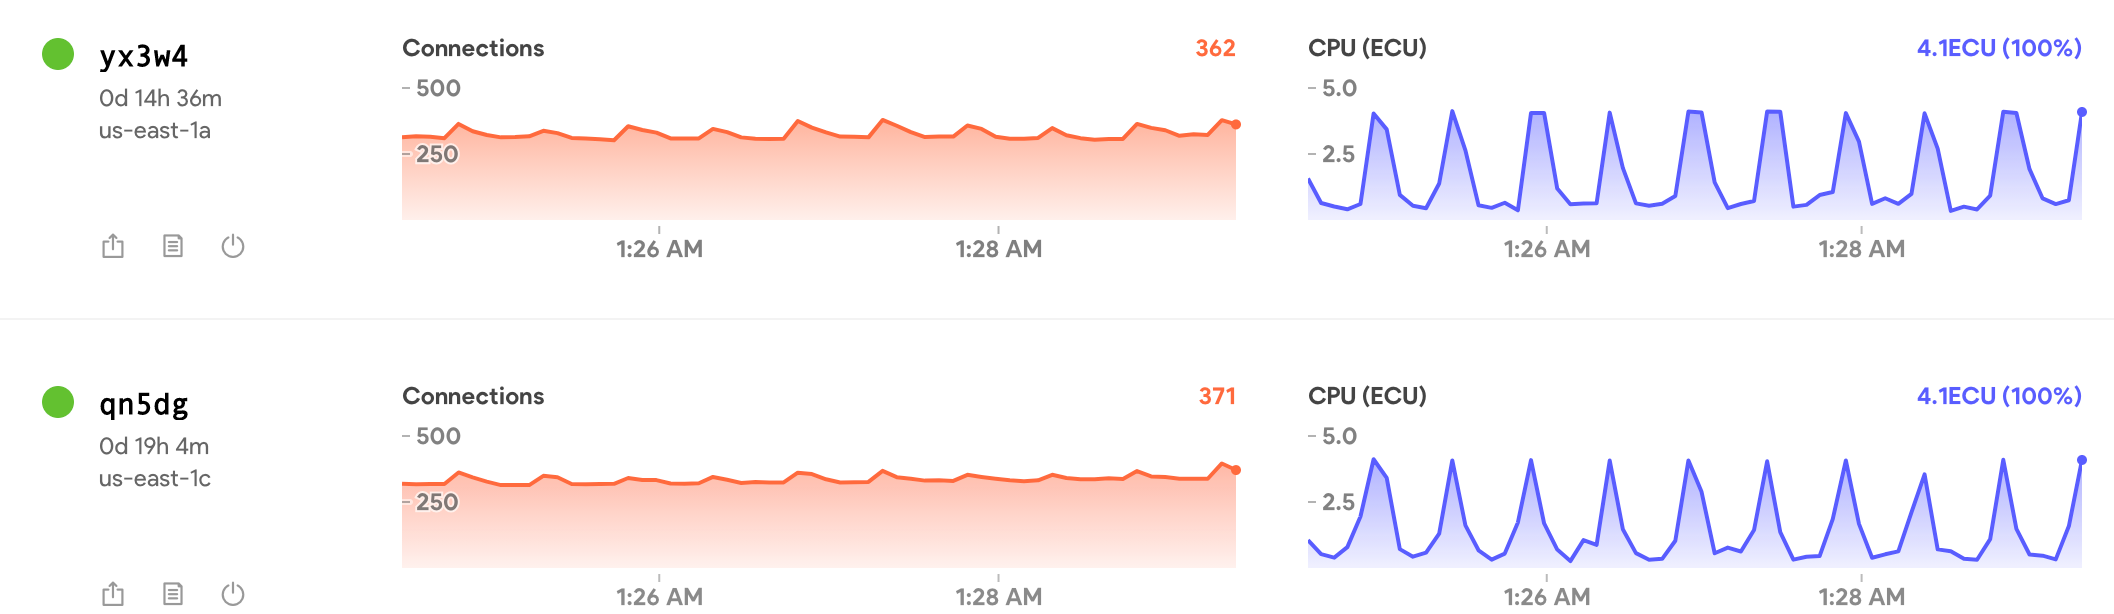
Notice the CPU spikes are about 30 seconds peak to peak.
More surprising, the CONNECTIONS also fluctuate on the same 30-second cycle.
Here is a snapshot of the Galaxy dashboard in the middle of the night. There are very few users online doing anything, but this is what the pattern looks like pretty much every night.
Note, these are “real” users, doing actual work. We have client code that Meteor.disconnect() after 8 minutes of idle on the client, so these users are actively moving the mouse or typing with their keyboard.
APM at this same time shows a typical workload of users doing what users typically do.
User behavior is not driving this pattern. Is there some kind of keep-alive or garbage collection or some other timed behavior in Node/Meteor that can explain this?
Has anyone else seen this is their app?
Any suggestions about how to track this down?
Again, notice the “connection” fluctuation, because that by itself could explain the CPU spike.
It could be garbage collection, although it seems too regular. However, looking at memory utilisation might help in checking that by correlating CPU peaks with release of memory.
Are you using MongoDB polling, rather than oplog tailing? Although 30 seconds would have to be a deliberate choice, since the default IIRC is 10 seconds.
What else is running? Could this be a scheduled task?
I’m pretty sure this is someone trying to clean up b/c it happen every 30 seconds and it looks like disconnect/reconnect. And truthfully, I think the cpu is just an artifact of the connection fluctuation. There’s a fair bit of work to set up a new connection.
This pattern only happens during periods of extremely low user activity. But, said another way, this only happens when running 2 containers. (instead of 10 or 50 containers) The CPU metric during heavy user loads (2x the connections per container on 50 containers) will look a little jaggedy, but rarely spike above 60%.
So, this makes me think that maybe the “load balancer” is smoothing out some “noise” for us. When looking at the graph above, the number of connections regularly fluctuates by about 40 connections per container. Why?
And if we are getting a similar set of 30-second fluctuations of ~100 connections (dropping/reconnecting?) all at the same time, then the load balancer could nicely spread those out across multiple containers and prevent cpu spike.
We don’t run any chron jobs on the server. (ok, 1 fires at midnight)
On the client, use an “autosave” feature which fires an rpc periodically, but that feature requires user interaction and a data change before firing. Also, APM tells us that this “save” is being called every second in a random pattern matching client use. (and of course it could not explain either the connection change nor the cpu spike)
We don’t poll. We recently added redisoplog, but this behavior predates that. (And redisoplog is absolutely amazing btw!)