I have followed the steps in this link to enable MongoDB Oplog Support for scaling my Meteor application.
March 18, 2014

In Meteor 0.7, we reworked how Meteor gets real-time database updates from MongoDB.

The key method that Meteor adds to the MongoDB API which makes it into a real-time database API is [`cursor.observeChanges`](http://docs.meteor.com/#observe_changes). `observeChanges` run an arbitrary MongoDB query, returns its results via `added` callbacks, and then **continues to watch the query** and calls additional callbacks as its results change.

Most users don't use `observeChanges` directly, but whenever you return a cursor from a [publish function](http://docs.meteor.com/#meteor_publish), Meteor calls `observeChanges` on that cursor and provides it with callbacks which publish the query's changes to clients.

Previous versions of Meteor only had one strategy for implementing `observeChanges`: the "poll-and-diff" algorithm, implemented by the `PollingObserveDriver` class.  This approach re-runs the query frequently and calculates the difference between each set of results. This code is simple and has historically contained very few bugs. But the cost of the `PollingObserveDriver` is proportional to the poll frequency and to the size of each query result, and the time from database change to callback invocation depends on whether the write originated in the same Meteor server process (very fast) or in another process (up to 10 seconds).

Starting with Meteor 0.7.0, Meteor can use an additional strategy to implemnt `observeChanges`: **oplog tailing**, implemented by the `OplogObserveDriver` class.
Meteor now knows how to read the MongoDB "operations log" --- a special collection that records all the write operations as they are applied to your database. This means changes to the database can be instantly noticed and reflected in Meteor, whether they originated from Meteor or from an external database client. Oplog tailing has different performance characteristics than "poll-and-diff" which are superior in many cases.

`OplogObserveDriver` needs to understand the meaning of MongoDB [selectors](http://docs.meteor.com/#selectors), [field specifiers](http://docs.meteor.com/#fieldspecifiers), [modifiers](http://docs.meteor.com/#modifiers), and [sort specifiers](http://docs.meteor.com/#sortspecifiers) at a much deeper level than `PollingObserveDriver`. This is because it actually needs to understand how write operations that it sees in the oplog interact with queries, instead of just relying on the MongoDB server to repeatedly execute the query. To deal with these structures, `OplogObserveDriver` uses Meteor's implementation of the MongoDB query engine, [Minimongo](https://github.com/meteor/meteor/tree/master/packages/minimongo), which Meteor also uses as its client-side local database cache.

As of Meteor 0.7.2, we use `OplogObserveDriver` for most queries. There are a few types of queries that still use `PollingObserveDriver`:
 * [Selectors](http://docs.meteor.com/#selectors) containing geospatial operators, the `$where` operator, or any operator not supported by Minimongo (such as `$text`)
 * Queries specifying the `skip` option
 * Queries specifying the `limit` option without a `sort` specifier or with a sort based on `$natural` order
 * [Field specifiers](http://docs.meteor.com/#fieldspecifiers) and [sort specifiers](http://docs.meteor.com/#sortspecifiers) with `$` operators such as `$slice` or `$natural`
show original
Although, to verify if the queries are using OplogObserveDriver it is suggested to use ‘facts’ package. I added ‘facts’ package to my application. Facts package provides a blaze template ‘serverFacts’ which will list the server metrics.
I am using React as my front-end and used gadicc:blaze-react-component to render the blaze component in react using the following code:
I also added the code to tell meteor which users can see the metrics by calling:
Facts.setUserIdFilter(function (userId) {
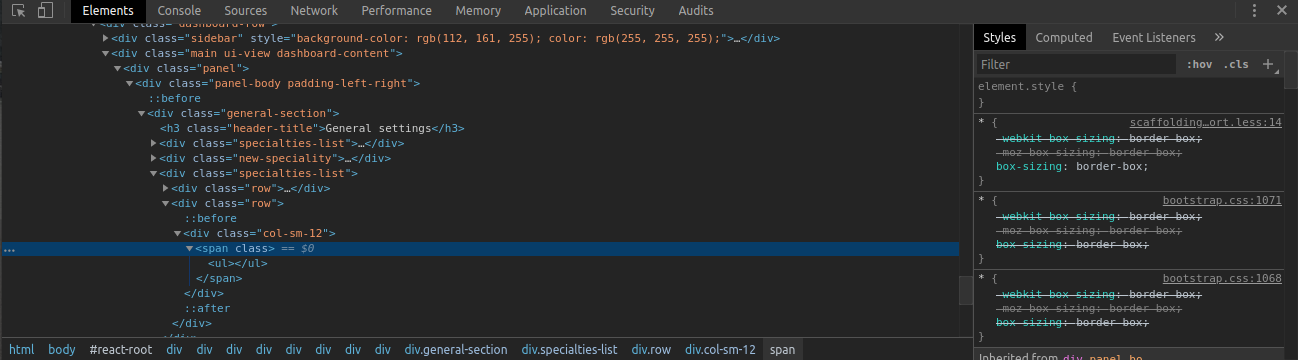
I am unable to see any of the server metrics where I rendered the “serverFacts” component. What I see in the browser’s Elements tab is just an empty ‘ul’.
Is there a problem in the way I am rendering it in the client side or should I be doing any additional configurations in the server side? Help is very much appreciated.
Thanks in advance,