Hey everyone.
I am looking for solution (a JS library I guess) to visualize relationships between company members.
Conditions and requirements:
-
There is binary structure of partners, max 10 levels to visualize.
-
Chart area should be zoomable - the more zoomed, the more info viewed.
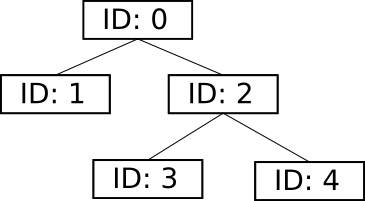
For example, bu default only ID vivsible:
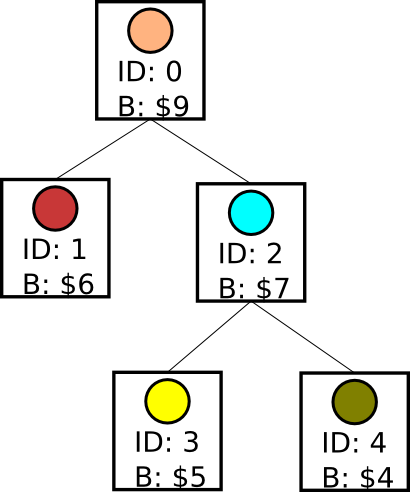
On the next zoom level avatar and another info added:
It’s desirable to chart lib handle zoom events.
- Chart area should be draggable so we can go to nodes not viewed right now.
- Arbitary html in nodes or nodes high customizable.
- There is no need to dynamically add new nodes by clicking some gizmos or
reorganize structure or drug and drop nodes - just render once and make it discoverable. - All behavior explained above same on mobile.
Is there any JS library with such functionality out of the box or with minimum customization?
I know all popular chart libraries, but diggint into each lib api may take a lot of time. Before I will sart it anyway, maybe some folks alredy did something similar.