Our app that runs on Galaxy is an audience participation app where participants join events. Participants often join very quickly in bursts. Last night we had a large event with about 2000 participants (on top of many other smaller simultaneous events) who were all in an arena, so same geographical location. Events can be both physical in-person and virtual (where there’s more geographical dispersion between participants).
We had a lot of customers complain about performance during the above 2000-participant event because, as it turns out, Galaxy loaded almost all 2000 of the participants onto a single host container versus balancing them out between our six 12x-size containers. It’s safe to assume the complaints came from anyone else on the overloaded container.
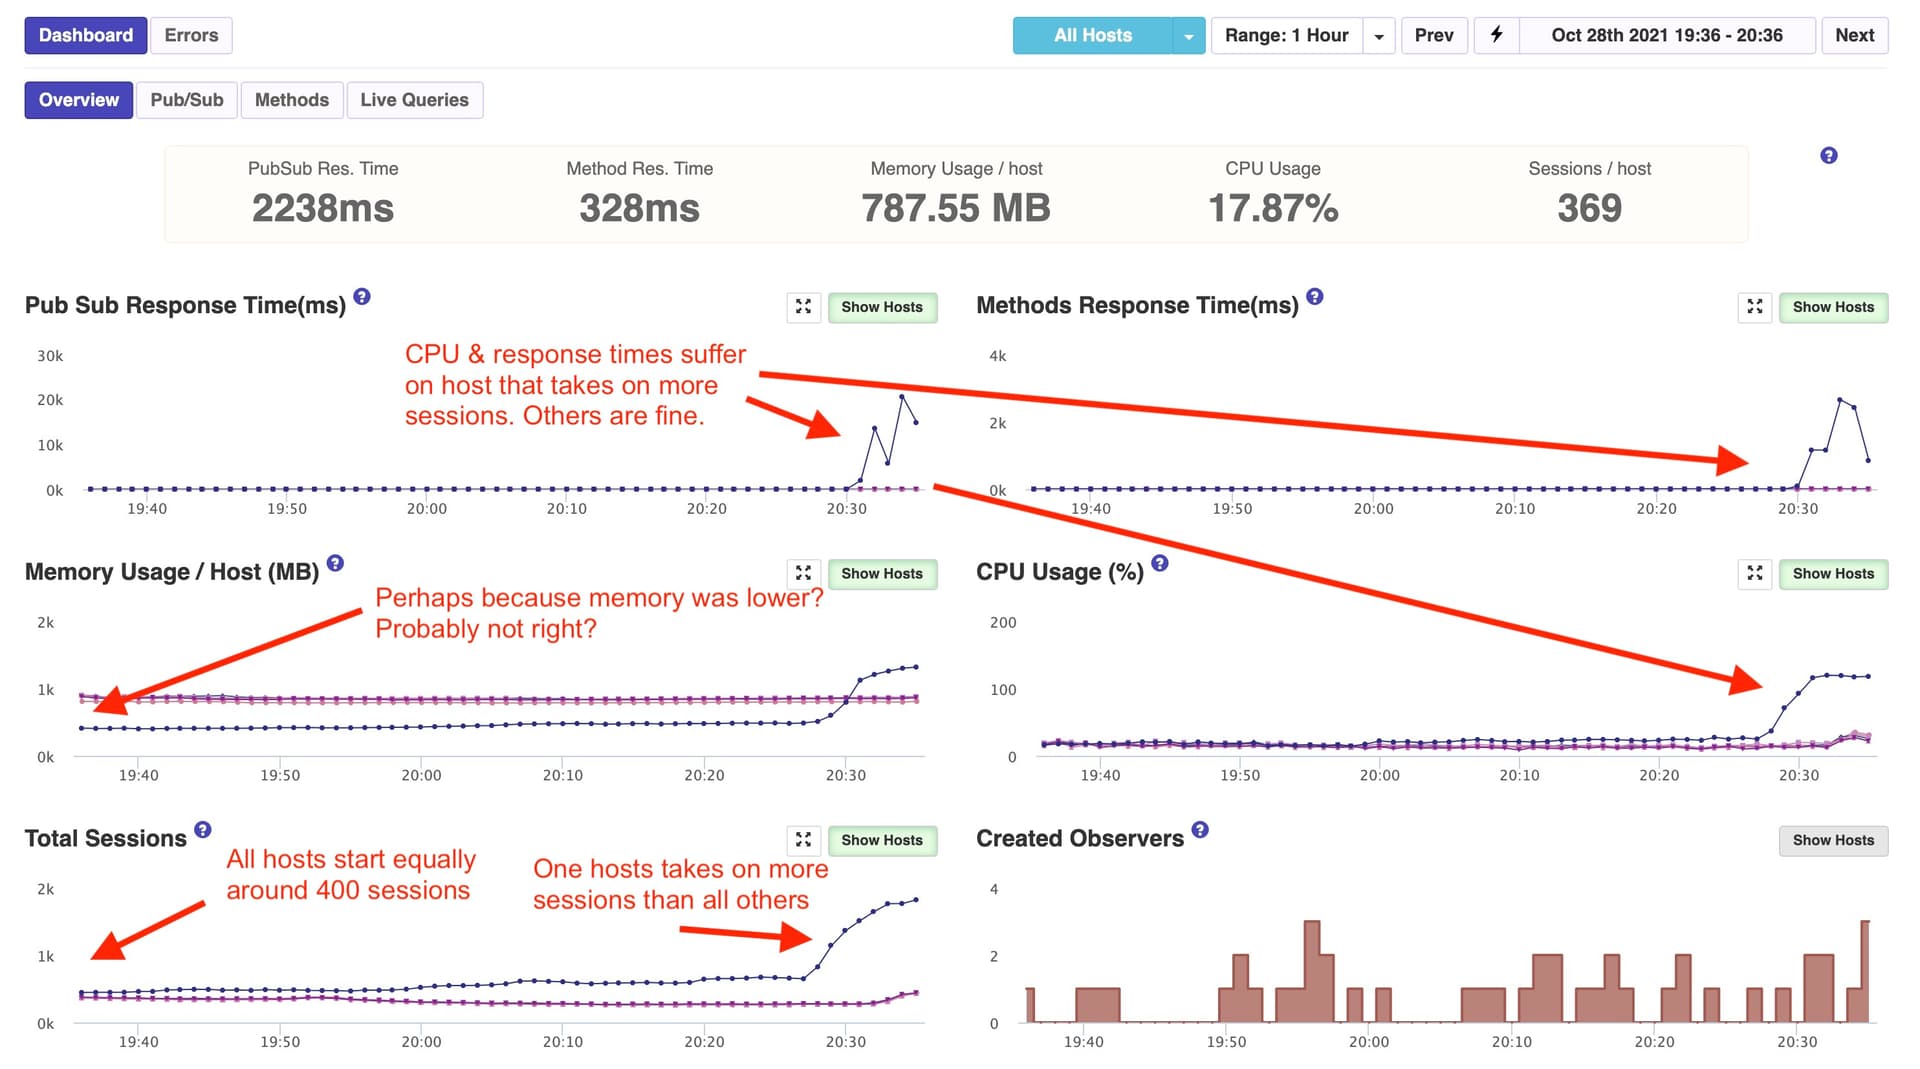
The only reasoning we can get to is Galaxy is either loading them on one container because of a geographic “closest container” routing policy or there’s some kind of bug/issue. As you can see in the below images, aside from memory, all containers were equal prior to the surge in sessions (participants).
APM Snapshot of All Hosts
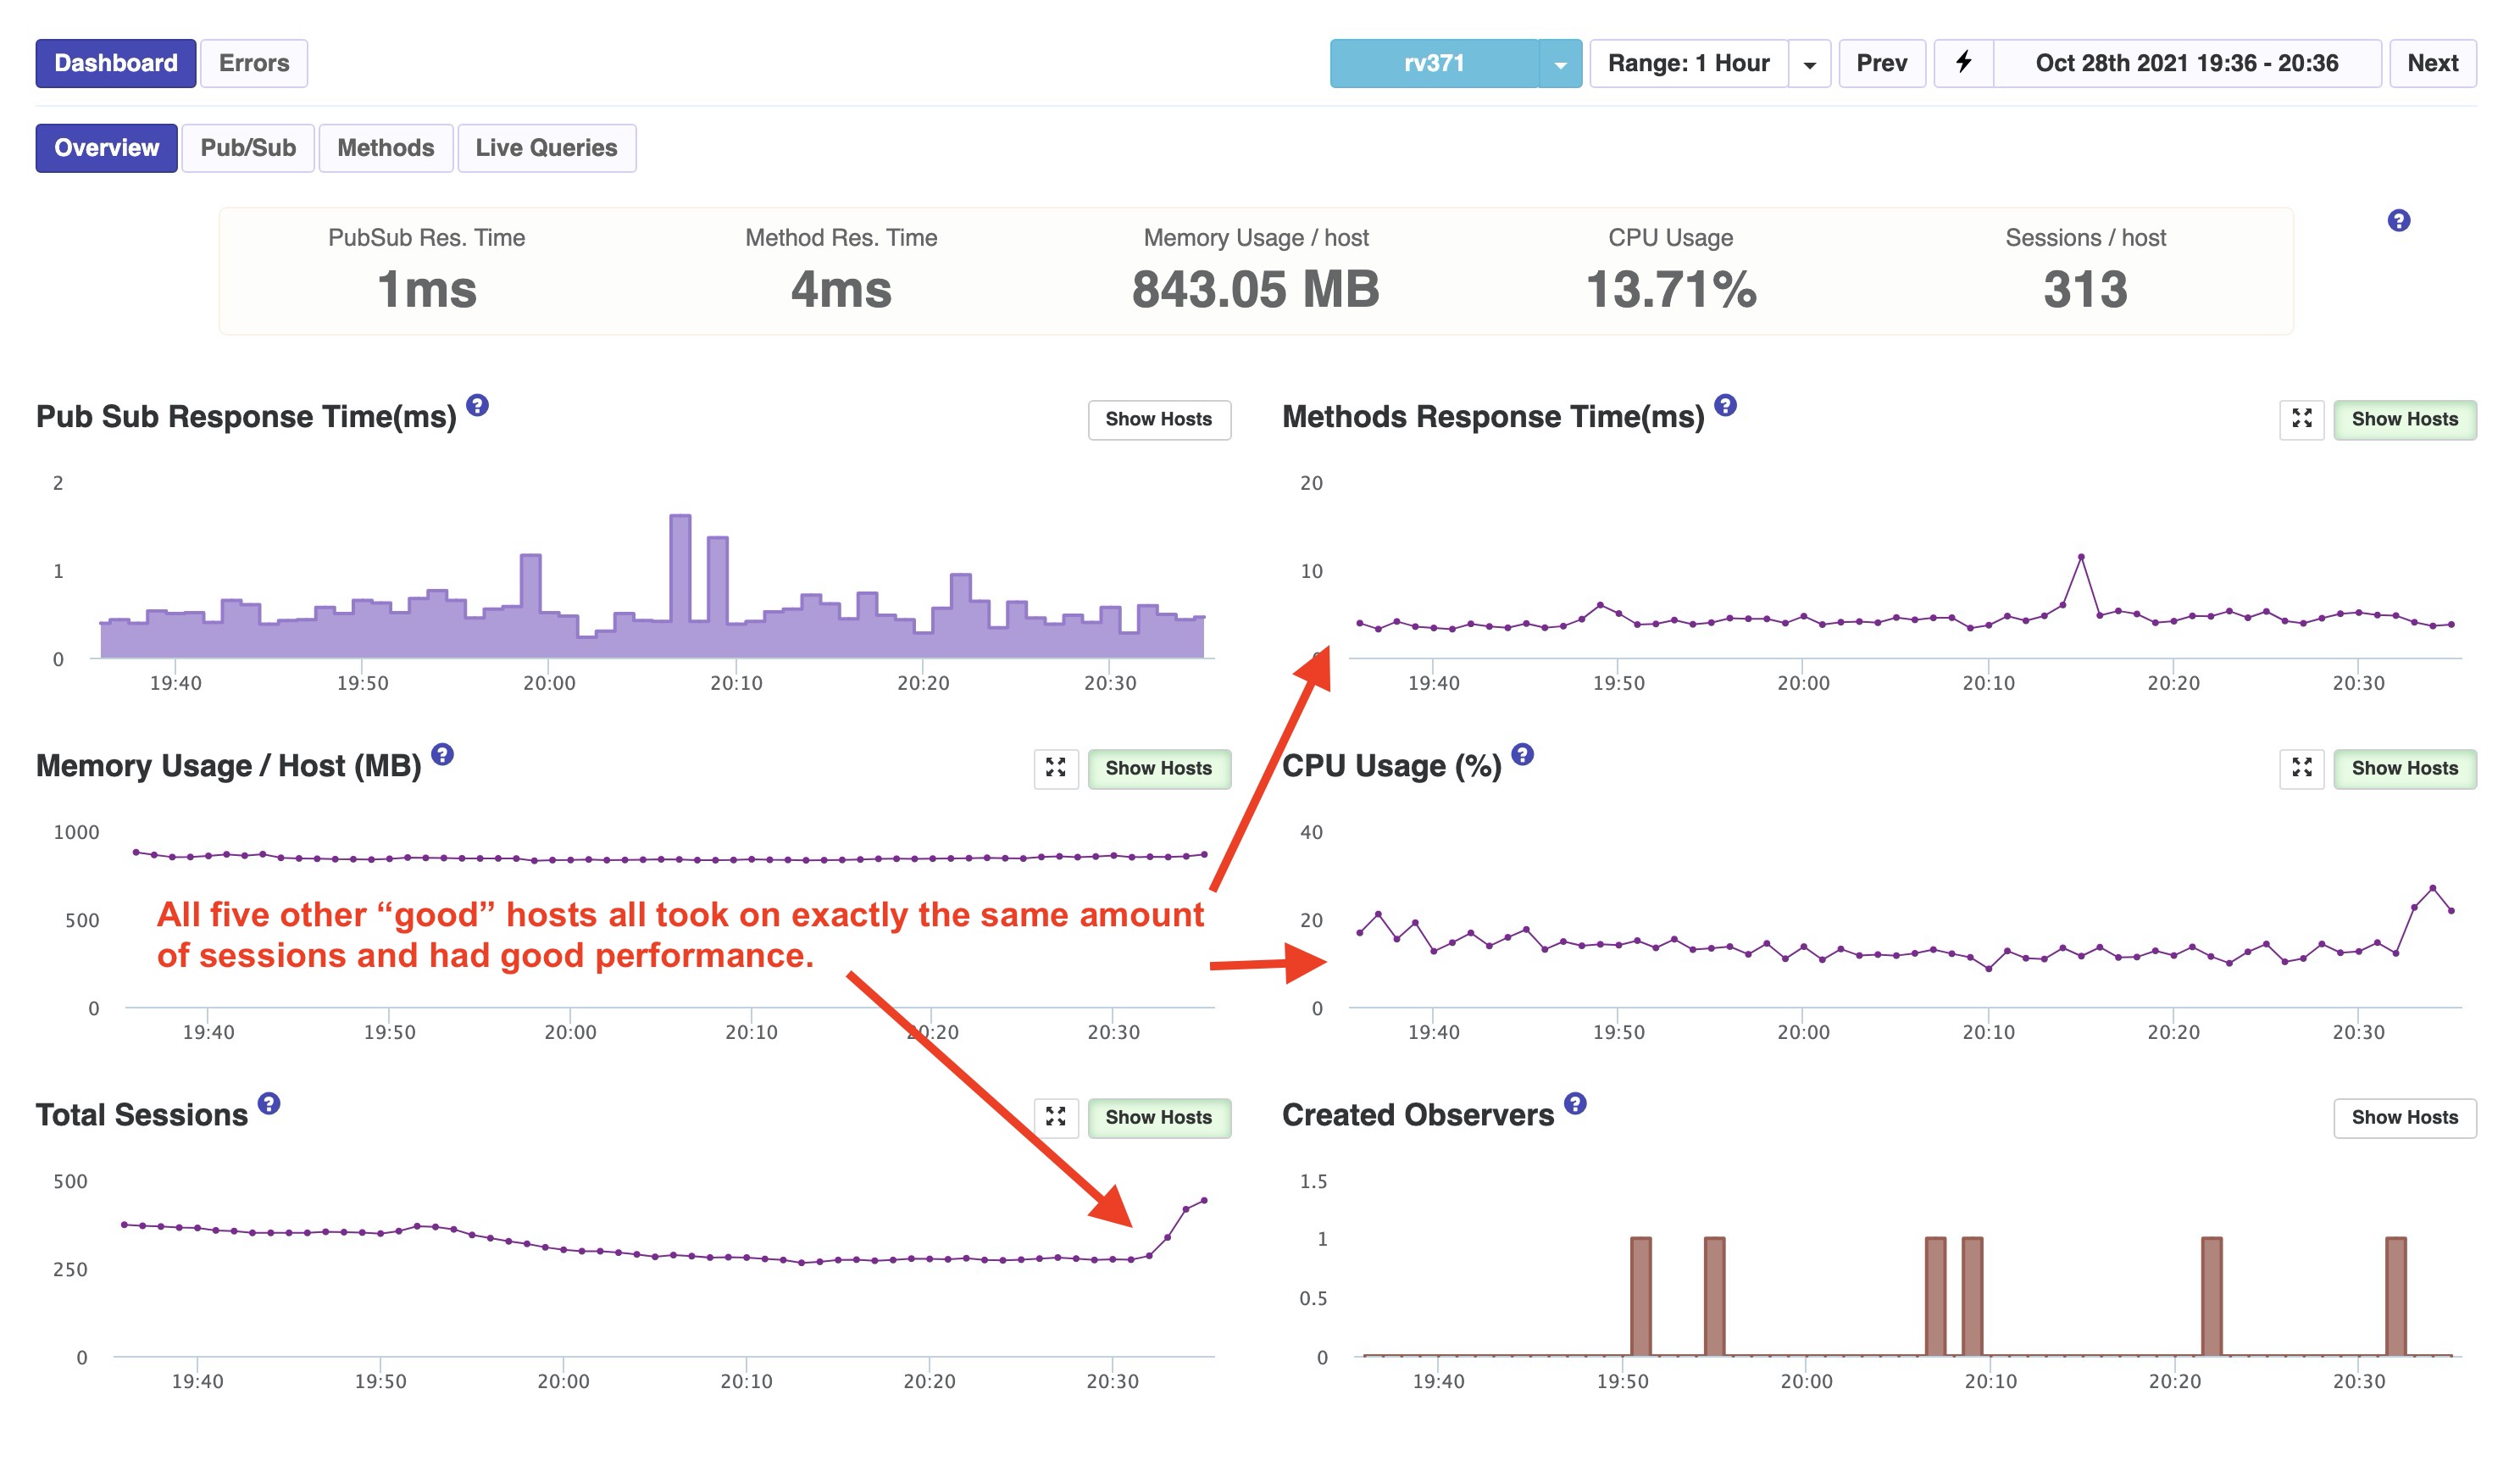
APM Snapshot of a Good Host (1 of the 5)
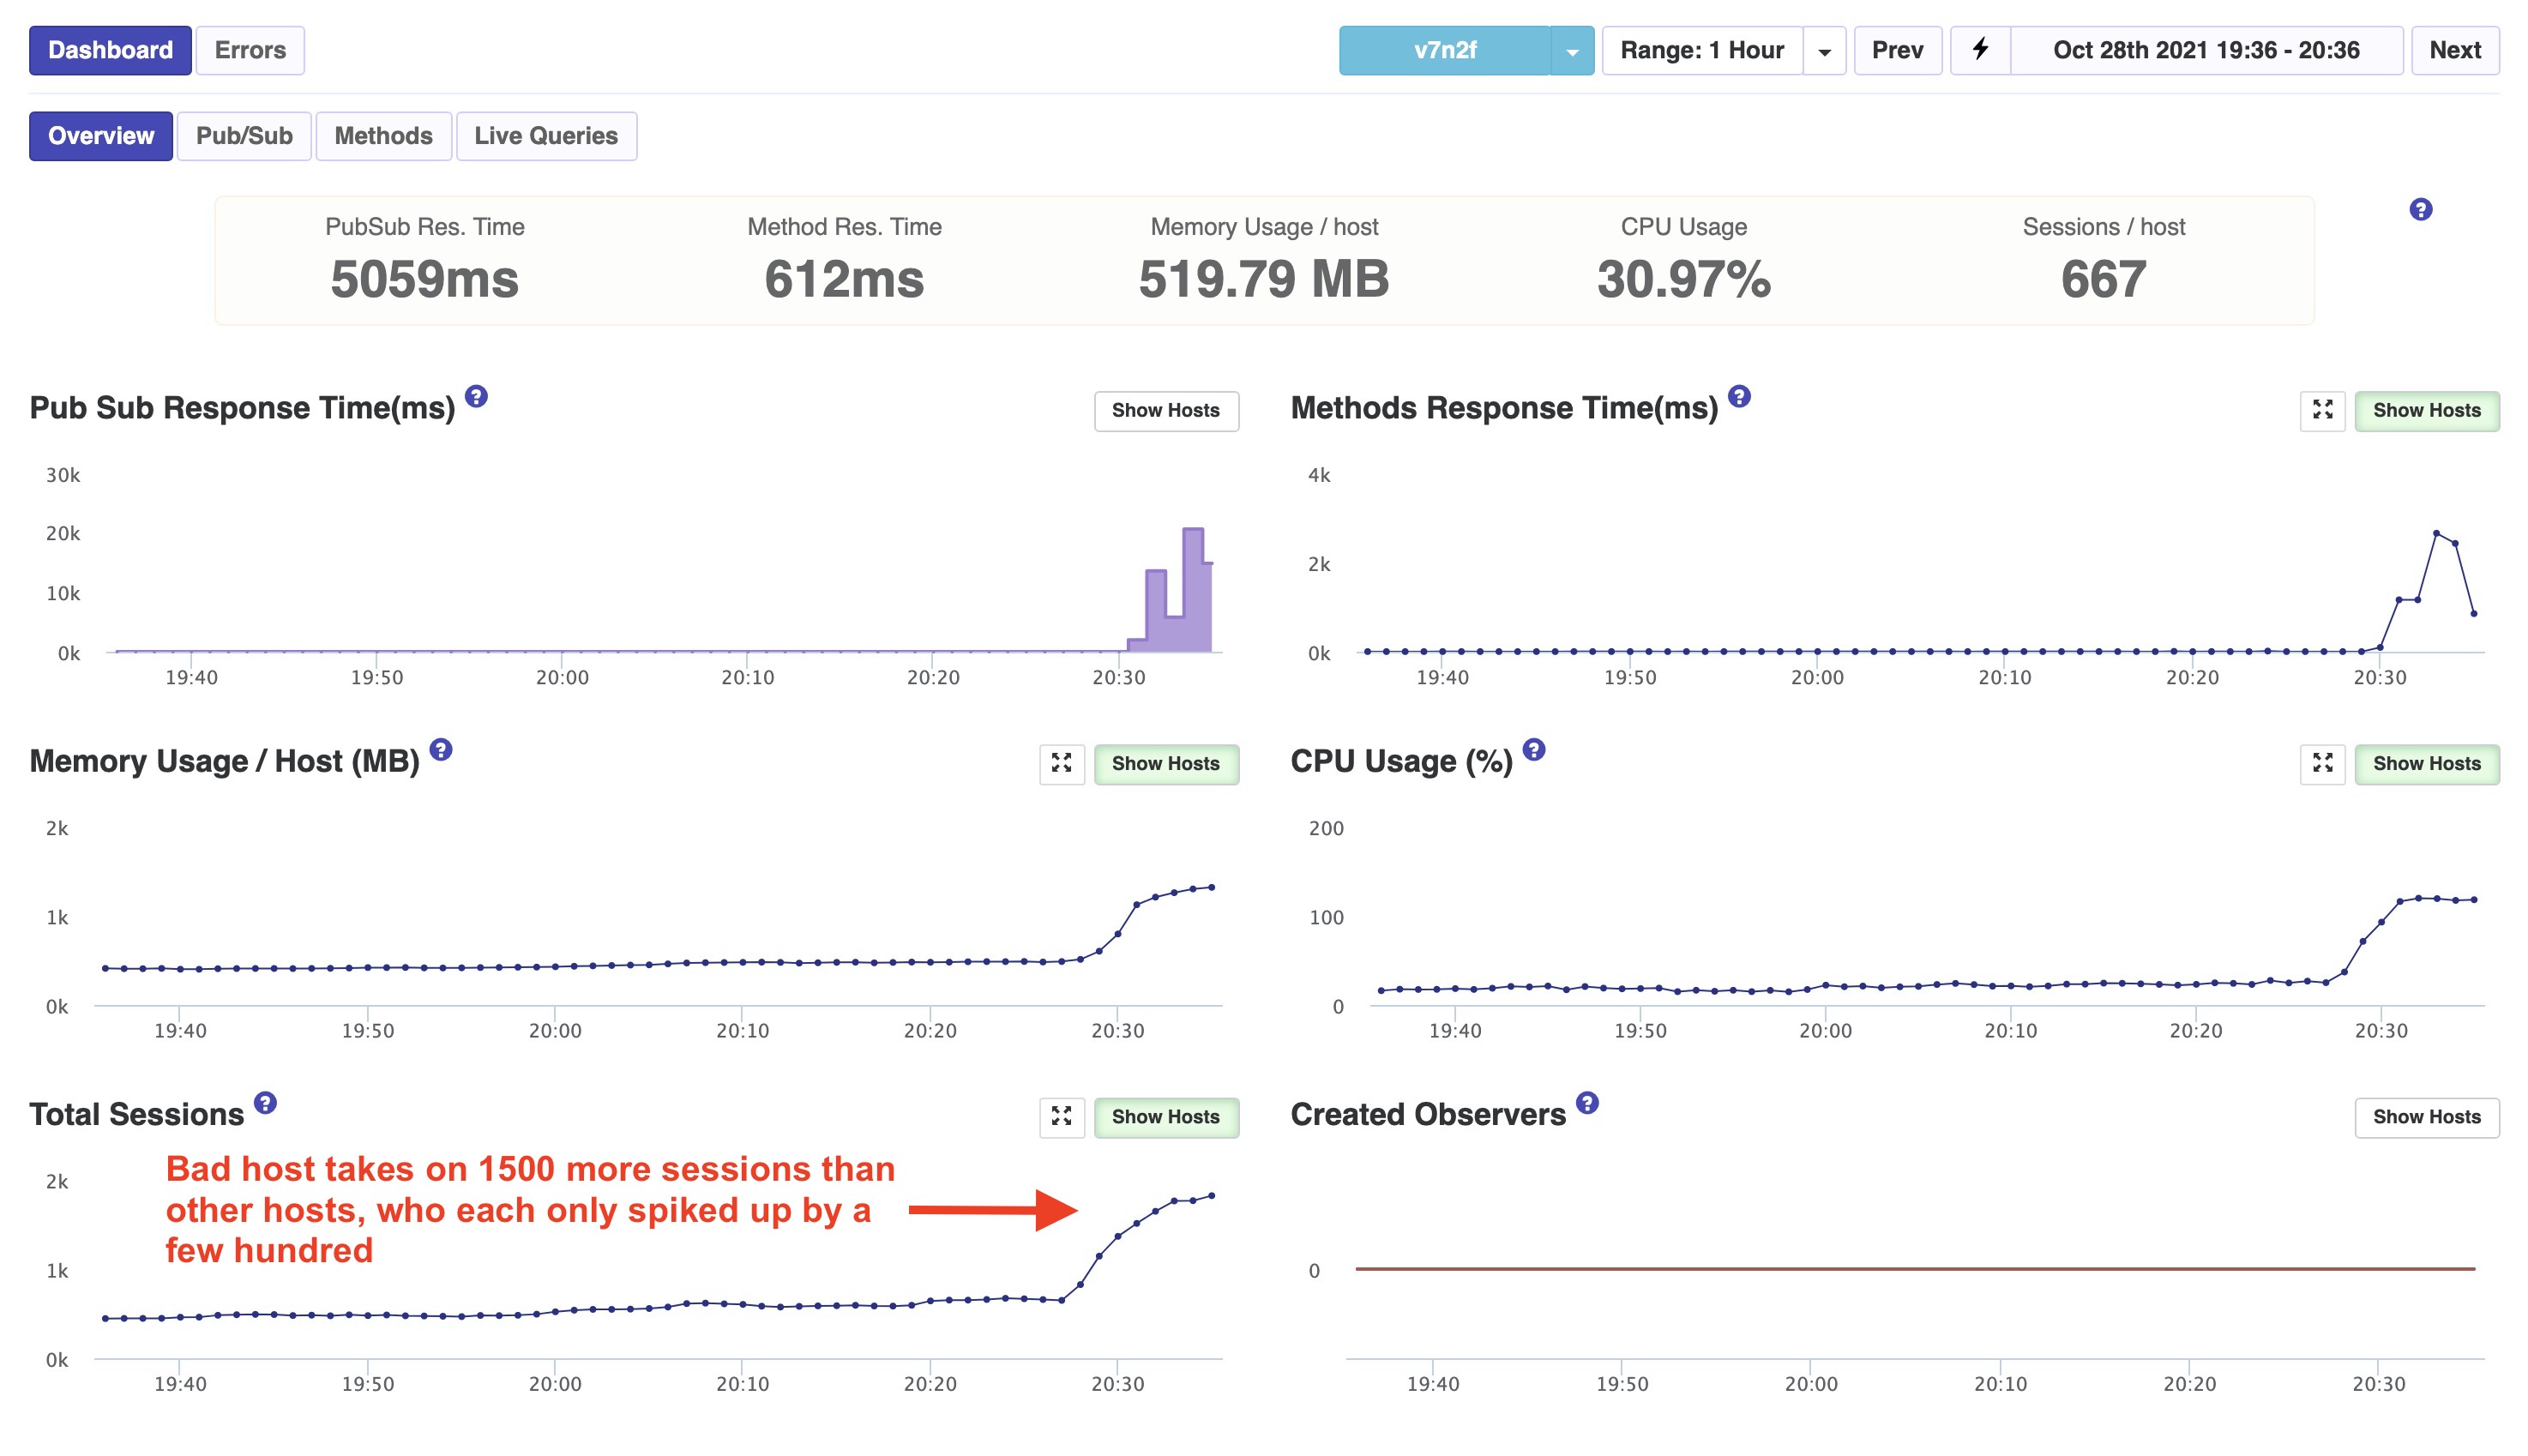
APM Snapshot the Bad Host
The weird thing is the customer who is doing the 2000-participant is on a national tour and they have events a few times a week, for several weeks now, and this is the first time we’ve seen this. Though, that’s not to say it hasn’t happened before. I could maybe understand if the container has just launched, or one dropped and this replaced it, etc. But before the surge, it was smooth equal sailing.
If there’s a Route 53-style geographical routing policy in place, that might be problematic.
Anyone else seen this? Possible Galaxy bug? @filipenevola
Hi @evolross responding to your question, no, we don’t use any geographical info to balance connection between containers.
This load that you had is pretty common for many apps that we have (see for example this study case) and I never saw this behavior before.
Galaxy balance connections based on the status of your containers, all your five containers were healthy during this time?
The balance algorithm hasn’t suffered any changes in a long time so we must have something else going on in your case.
Feel free to open a ticket so we can check more details together and even jump into a call if necessary.
A note: Dozen containers (I believe you mean Dozen containers by 12x-size, right?), by the nature of Node (more here specially in the videos linked in the top), could be unhealthy even with plenty of CPU available as the event loop can be busy no matter how much CPU is available, this happens less often when you have less CPU power. This is why we recommend Quad as the best container size for apps with high CPU loads. Octa and Dozen are more for urgencies when the app has some code that needs to be optimized but there is no enough time, we created them to help clients in specific situations.
I’m not saying that was the cause of this weird balance, I’m just bringing up this point here for awareness.
1 Like
@evolross another way to mess with balance is if somehow multiple clients are sending the sticky cookie for the same container.
Is there any chance they are in the same network or in any environment that could have some influence in their cookies?
I removed what was here in this paragraph because I was talking about an option that is not possible as this cookie is secure, so this wouldn’t be possible. The text here was asking about people trying to trick the system, creating more connections with the same cookies.
I’m thinking out loud here, maybe one container was older and a lot of users have already connected to this specific container in the past, but all the other containers were new, so all the cookies were still valid and pointing to the only old container. This would be weird as this never happened before but it seems to be an option. The sticky cookie is a session cookie but maybe somehow the session was still active?
Thanks for the response.
All the containers seemed to be healthy. There were no unhealthy messages in the logs (or email notifications - as we have it set to email when a container is unhealthy).
All the users were in one geographic location in an arena. I highly doubt they all joined the same WIFI network as it’s a quick “pull out your phone and vote” type of use-case. Usually they would all be connecting through cellular. Though some of those arenas have their own hardware that mimics a cellphone tower but is actually the arena’s own WIFI-esque system. None of the participants would have been previously connected or had time to do any trickery. But they could have potentially all been on the same “network”. Might explain why it hasn’t happened at other arena events on this tour.
One curious behavior is the other five containers all did have an equal increase at almost the same time. So they were apparently onboarding some of the surge of session and in equal amount. It was just the one container that loaded so much more. That was actually a new container than the others. It has been started about two hours before the surge. Likely due to a standard Galaxy replacement.
And indeed, we are running dozen-size containers just to have less connections to the database and redis. I wasn’t aware of possible Node issue because of this. We have no high-processing requirements for this service. So I’ll switch them back to quad-sized containers.
Does Galaxy have the ability to hit a specific route to determine if the host is not just healthy, but “ready”? This is a trick that can be used in k8s, for example, when a host gets too busy, to remove it from the LB rotation, without disconnecting any users from it (and causing a cascade).
You could have that route look at the number of connections, memory usage, CPU or anything else you want to stop being “ready”.
The container that had more connections was a newer or older container?
Because what can happen is that if one container already had a lot of connections and then new containers are started, so as we don’t rebalance connections to avoid reconnections the older container is going to be with more connections.
A few clients have a trigger to kill containers under heavy load so this spread the connections to other containers automatically.
We are also thinking about new improvements in our load balancer to be smarter and maybe start to rebalance existent connections as well, but every choice has trade-offs.
1 Like
A few clients do “this” using a trigger to kill containers if they are not in the ideal state. But it is a good idea to have some kind of custom settings to determine if a container is “ready”, ie, should receive more connections.
We are going to include this idea in our internal discussions, thank you.
@filipenevola I’d like to learn more about this. For example, if a container is killed, are the sessions for logged in users maintained? If there’s a link where I can read up on this, please post it. 
1 Like
Hi @vikr00001 you can read more about it and how to use here.
1 Like