This is a bit of a head scratcher. Any ‘out there’ theories appreciated.
For various reasons, we have migrated our production app to and from Galaxy twice over the past 12 months. And without fail, we get the below warning from Mongo Atlas when we are running on Galaxy. The same exact code on AWS directly does not trigger this.
OPEN
Query Targeting: Scanned Objects / Returned has gone above 1500
app-shard-00-00-p6urt.mongodb.net:27017
Created: 2019/09/12 18:08 AWST
Replica Set: app-shard-0
Type: Primary
Current Value: 2,927.4
The spikes (and related alerts) happen throughout the day, opening and closing 3-4 times per hour, during the business day. Some notes:
This is 100% related to being on Galaxy. After two migrations back and forth, there is no doubt about this
I had, at the start, thought it might be an oplog issue. But we can rule that out now as we migrated to Redis Oplog a couple of months back (or do we need to explicitly ‘switch’ something off on Mongo?)
I have spoke to the Atlas team at length and between all those chats, hours spent trying to decipher Mongo logs and going through every single db query in our codebase, I genuinely do not think this is the result of an unindexed query. The Galaxy vs AWS difference further makes me think this is something to do with Galaxy vs anything else.
The latest migration to Galaxy happened a couple of hours back (and immediately we started getting these alerts). This migration happened after an AWS server crash due to something related to the node garbage collector. I do no know if there is a memory leak (to be investigated) and whether this has any bearing at all on these Atlas warnings…
Questions:
Have any of you seen anything similar to this warning before?
Anyone have any theories about what might be causing this? Or ideas about the relationship with where the application is hosted?
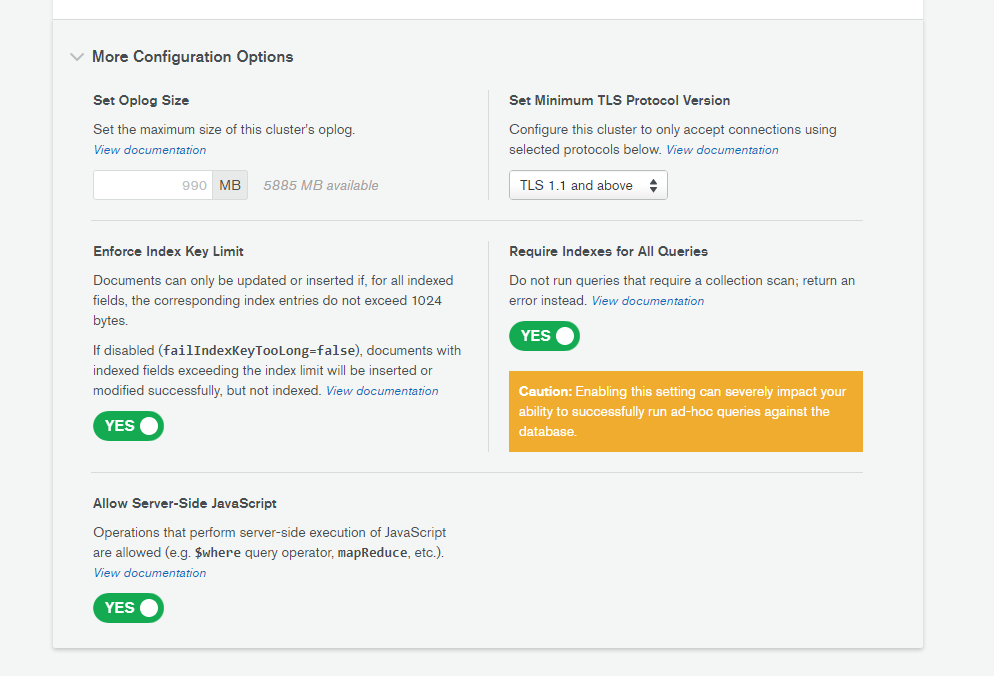
I was getting the same alerts from MongoDB Atlas directly, this is something related with queries not running with Indexes. Since everything was using indexes I modified the MongoDB Atlas configuration to only run Indexed queries and everything is working perfectly and the Scanned objects value is always between 1-5.
So everything was using indexes, but you were getting this error anyway? That implies Mongo Atlas is running things inefficiently unless you explicitly ask it to not do that?
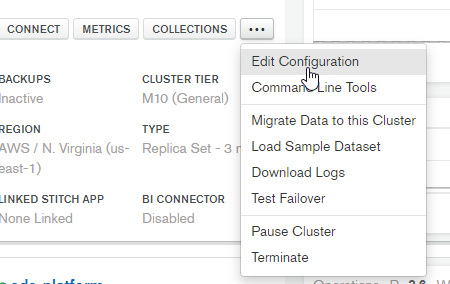
It was something very weird, everything was using indexes and still we where getting alerts from MongoDB Atlas. To modify the configuration you go to Edit Configuration :
I am hosting the site out side of Galaxy but been seeing this problem for months.
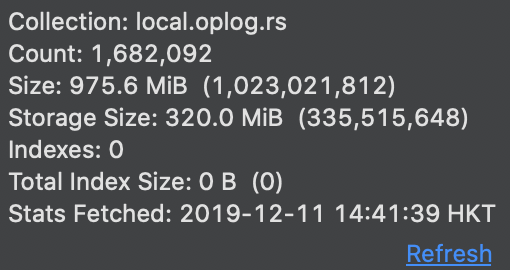
I have a feeling that it is meteor’s oplog scan that is causing this as local/oplog.rs is the only collection in my MongoDB with over 1k objects (around 1.6 million)
Interesting - my initial suspicions were also oplog related. But I shelved those suspicions after moving to redis-oplog.
Question to anyone more experienced, do mongo oplog queries occur even if redis oplog is being utilised?
@drew - I don’t use easy search but do use fuse.js. Unless I have messed things up though, the search queries should all be using only indexed queries…
Is there a way to get the scanned objects/objects returned ratio live, per query, on the local mongo? I would love to play around on my dev environment and perform different actions to find the cause/rule possible causes out