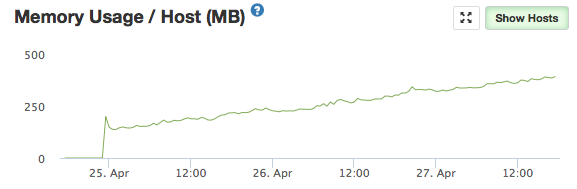
I have upgraded to Galaxy “professional”, only to find that it has the same issue that forced me to turn off Kadira monitoring some months ago (before it was abandoned). Nice to see that Kadira found a good home but…here’s how my memory usage goes:
This is definitely down to Kadira as I had stable memory before the upgrade and I had the same issue before as mentioned.
So, am I alone? … and can this please be fixed or I’ll have to “downgrade” pretty quickly!
We’ve seen something similar - though not quite as dramatic as your graph demonstrates. We’ve been trying to pin it down as we made various changes about the same time.
But it looks we need to try a couple of days with Kadira/Meteor APM disabled.
I downgraded from Professional. But Galaxy still seems to have Kadira active as evidenced by 2 things:
The log shows Kadira: completed instrumenting the app on start up?
My memory still grows
I have a nasty feeling it’s still working in the background only I don’t get to see the reporting!
Any comment?
And my container crashed today with a suspicious 2017-05-17 20:17:36+01:00 at [object Object].kadira_Cursor_forEach [as forEach] (packages/mdg_meteor-apm-agent.js:3727:34) entry in the stack trace (though the error seems to be a time-out to my Mongo DB)
I am not alone. I noticed the same thing and I removed APM from my app and redeployed. Even after removing APM, I still get activities when I click on the view APM link. This shows APM still works even after removing the package.