I am currently experiencing pretty slow response times across my production app and I’m trying to interpret the APM data to make sense of what’s happening and why.
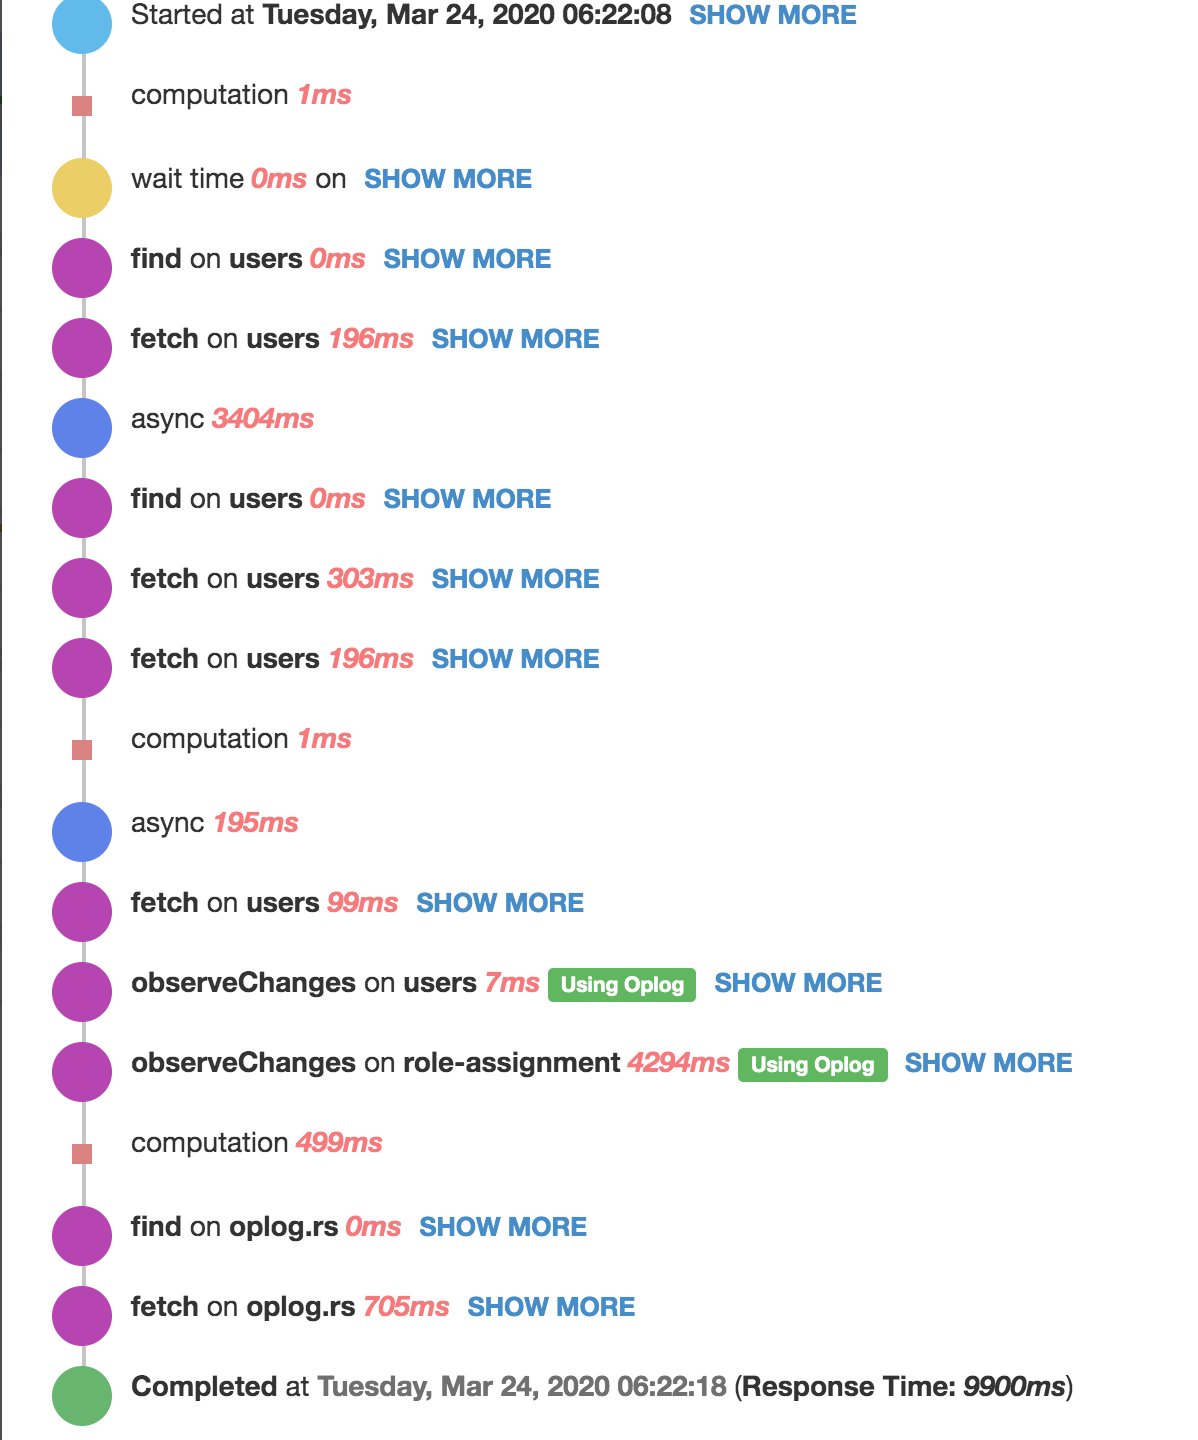
As an example, logging in can take up to 10 seconds…
Is async the data transfer time or something else?
This method is called with the Meteor.loginWithPassword method. Is it normal that I would be doing multiple finds/fetches against the users collection?
I have plenty of other slow responding publications and methods but I think this is a good one to tackle first.
For info I’m hosted on Galaxy/MLAB in the same region.
I’ve seen worse. In my experience, most of the time such low performance was a result of the high load on the CPU of the server. You should take a look at the CPU metrics in APM at the moment of this login method call had happened. There might have been a spike or a steady high load on the CPU at that moment.
It is some async task, could be anything; sometimes even looking at the code of the method does not give you a clue where this async task comes from, especially when these async tasks appear in random places in different traces of the same method.
Yes, it is normal. But, it would suggest comparing several ‘loginWithPassword’ method’s traces to see if the traces vary.