That might be a different issue. We have specific handling for this for different methods. Our last remaining issue is related to the built-in login resume of Meteor (not sure if that is the same password-less error that you are mentioning)
This is pretty much the same as in passwordLess I use GitHub - meteorhacks/inject-data: A way to inject data to the client with initial HTML to add a token client side so that I can do to loginWithToken that is the same as the resume login in meteor
If you have control over that method call, then you can also debounce that event. Another way is to increase the frequency of allowed calls for that method. In our case, most issues are solved by debouncing from the client side or ensuring that unintended re-rendering of components are not causing multiple method calls. For the case that it is expected that frequency to be high per client, then we asjust the ddp rate limit for that method.
2 Likes
See our comment here please Slow oplog tailing on ATLAS (reactivated issue) · Issue #11578 · meteor/meteor · GitHub
1 Like
See our comment here please Slow oplog tailing on ATLAS (reactivated issue) · Issue #11578 · meteor/meteor · GitHub
Hello and thanks for all the replies!
I had a phone call with MongoDB Atlas support today and we reiterated that we can both recognize the issue, but since nothing is appearing on the database statistics side, it’s hard to pinpoint what is going on. We’re still testing a few things, but haven’t had any success yet.
@filipenevola - We already have Redis Oplog enabled on our project. This issue is still occuring.
One strange thing we noticed on the call is when the performance degradation occurs, the Galaxy APM is showing a very high response time not only on methods, but also on pub/sub. If we’re using Redis Oplog, shouldn’t the response time for pub/sub stay low based on the redis server? I’m not 100% sure how Redis Oplog appears in the APM.
1 Like
Hi, Spyridon.
shouldn’t the response time for pub/sub stay low based on the redis server
That’s not exactly true! If your DB is not ok, redis-oplog won’t do much. On every change event, redis-oplog fetches a full copy of the changed document before propagating the changes. If your db is slow, this will be slow too!
On the other hand, if you saw degradation without changes in your code or changes in the audience, there is a big chance it’s in your DB.
3 Likes
Going to add my voice to those having the scanned/returned ratio has gone above 10,000 issue (10,000 because I got sick and tired of getting this message too frequently at a lower limit). I’ve been trying to debug it for months - it doesn’t seem to cause any performance problems.
Hunch I’d like to get others’ thoughts on:
One idea I had was that this is being triggered by lots of count() operations. And anecdotally, reducing these has led to fewer triggers (I haven’t yet been able to completely remove/reduce the count operations to test this though and not sure I will be able to).
1 Like
What did you replace it with? countDocuments()?
No, I decided to store the counts in question (3 of them for each user) on the database instead (under the users collection).
It’s a dirty and ugly solution but provided a huge spike in performance. Particularly as the count() code I was using was via the performant counts package - so it would have been running the count every 30 seconds (the interval I had set). Multiply that by so many users and multiple sessions and it adds up.
There are still a couple of places where the count() is being used - but it isn’t feasible to store the more dynamic counts on the database. That would lead to dozens of counts per user, complicated code and a lot of surface area for the counts to fall out of sync. I haven’t figured out a solution to this yet 
I have a hacky idea to reduce the number of count operations by reducing the reliance on performant counts - that may provide more clues as to whether count() is the culprit.
But I thought I’d put this hunch out there to see if everybody else getting these mongo alerts is also using count() and whether it’s a pattern.
1 Like
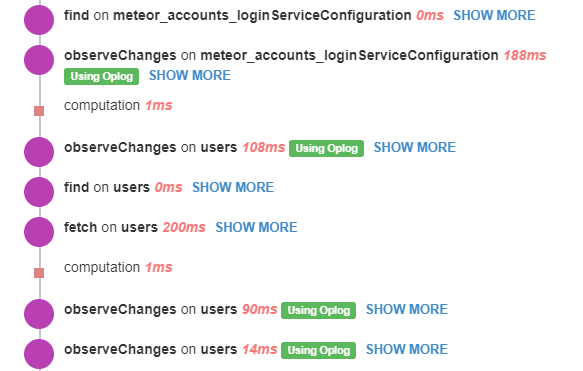
Question, if I’m using Redis Oplog, should the APM still be listing observations as “Using Oplog”? Example:
Hi, Spyridon.
Our APM agent uses a custom logic for identifying oplog usage. This logic is also being used by redis-oplog to wrap with a custom observer.
In our APM code we have:
observerDriver = ret._multiplexer._observeDriver;
var observerDriverClass = observerDriver.constructor;
var usesOplog = typeof observerDriverClass.cursorSupported == 'function';
endData.oplog = usesOplog;
If you see, we only check if the multiplexer observeDriver has a function called cursorSupported in its class.
Redis-oplog implements the exact same interface: redis-oplog/RedisOplogObserveDriver.js at b2be29ddc2feee460d248a7e5daffd2883c4e512 · cult-of-coders/redis-oplog · GitHub, so APM will always see as if it’s the default oplog in the UI, but in reality, it isn’t, it’s redis-oplog.
tl;dr “using oplog” should be shown!
1 Like
Storing counts like this aint dirty, its pro. That’s how you get stuff moving fast. A count seems simple but it actually is very resource intensive, especially over a million records. Even with a 16 core it can run like crap.
You can store thousands of counts and stats, especially even for data that is filtered, ordered and going into different time frames - seconds, hours, months etc just use memcache.
make keys like aLabelYouSpecify_userid_orderedby_timeframe_etc_etc_etc and chuck them in memcache. It loves it.
memcache performs significantly better then redis, you just gotta know how to use it like this to get the maximum power out of it. When you know to use memcache you will have no need for redis, it’s a over engineered keystorage imho.
1 Like
So how do you guys ensure that the count is correct (the one that is stored) and you need to trigger a new count() due to insert/delete/update?
In pseudo code:
If cache exists
Use cache
If cache doesn’t exist
Get count and store to cache,
set ttl for X minutes
Cache expires automatically after X minutes
You run the above either on user interaction, or if you prefer you can do it in cron to always have a pre-warmed cache.
This design pattern can be applied to any request for data, it is a caching layer. You can also update the cache whenever you want by overwriting it. So in the case of an update or insert you can then also run a set action subsequently in the same block of code.
For example in pseudo code:
On user action
Update database with new data,
Overwrite relevant cache keys
1 Like
@waldgeist, @dokithonon, @vooteles, @hemalr87, and anybody else experiencing the scanned/returned ratio has gone above 1,000 issue: have you solved this?? We receive tens of email alerts from Atlas every day. We can up the Alert threshold to 10,000 as @hemalr87 did to stop them, but then I worry we will miss “real” alerts in the future. I can see from the logs that the Oplog tailing is the culprit, but that is all – complete mystery. We are hosted on Atlas with an M10 and running on MongoDB 5.0.14 and Meteor v2.10.0. We’ve been experiencing this issue at least since we upgraded to Meteor v2.7.3.
1 Like
Are you using Redis oplog?
If you have identified the culprit as oplog, then that is a quick and easy fix. In our case, we are consulting with the atlas team in the next couple of months.
It hasn’t had any issue as such, but I’m pretty sure the culprit in our case are count queries.
No, unfortunately I was never able to resolve this. It’s still nagging me when I see these e-mails coming in.
Same for me, did not find a solution. It did not cause any issues for the app though, so did not contact Atlas’ support back then. Would be great if somebody identifies what causes this.
Thank you, all, for the updates.
@hemalr87 We aren’t using RedisOplog. I’m not familiar with it. Do you think we should switch to RedisOplog? As for the culprit, I thought it was the oplog tailing because I could see from Atlas’ logs that the alerts coincide with “collection scan” operations from the oplog that are examining ~10,000 docs. However, I’m now noticing that these queries are returning 0 docs. So I’m a bit confused. I’m pasting ashortened example of the oplog query log below.
{
    "c": "COMMAND",
    "msg": "Slow query",
    "attr":
    {
        "type": "command",
        "ns": "local.oplog.rs",
        "planSummary": "COLLSCAN",
        "keysExamined": 0,
        "docsExamined": 9238,
        "numYields": 10,
        "nreturned": 0,
        "reslen": 228,
    }
}```Do you think we should switch to RedisOplog?
If the oplog is the culprit then this is likely to solve it, yes. If not, then it won’t resolve the issue you are having but may still be something you wish to do (if not straight away then sometime down the line).
Looking at all the other responses here, this seems to be a common occurrence? Or just confirmation bias from the nature of this thread?
If it is common, I wonder whether it is:
- Something underlying in how Meteor interacts with Mongo or
- A common pattern misstep we are all making in how we are querying the database?
I find it weird that all of us have this issue, all of us are bothered by the alert(s), none of us have found the cause and none of us have any major issue with performance in spite of this alert.
For my part, we are trying to determine whether count() queries are causing the issue. Is it possible the same is happening with your applications @waldgeist @vooteles ?