Horrible degradation of performance using Galaxy and MongoDB Atlas

(Apologies if this is scatter-brained writing, been fighting this for days now and am at my wits end trying to figure out what’s going on).

As of approximately Friday, our performance has significantly degraded on our application, and it seems to be resulting from MongoDB Atlas, but haven’t been able to figure out why. Any advice or assistance would be appreciated.

The strange part is that we had not many any significant changes to our software during this time. Especially in relation to database access, we’ve only done some visual updates/etc in the last few weeks.

Long story short, our software is made for in-house usage at our business, with usually no more than 10 users connected at once, so scaling shouldn’t be a huge problem. We’re already setup with Redis-oplog, and the Redis server does not seem stressed at all.

Our application has been slipping between unusable, and barely usable. We’ve had to use an “emergency mode” to only do the most important server functions in order to even use the app, if we turn on “regular” usage (using routines for stock updates/etc) it’ll crash within minutes.

Here is a screenshot from our MongoDB Atlas metrics:

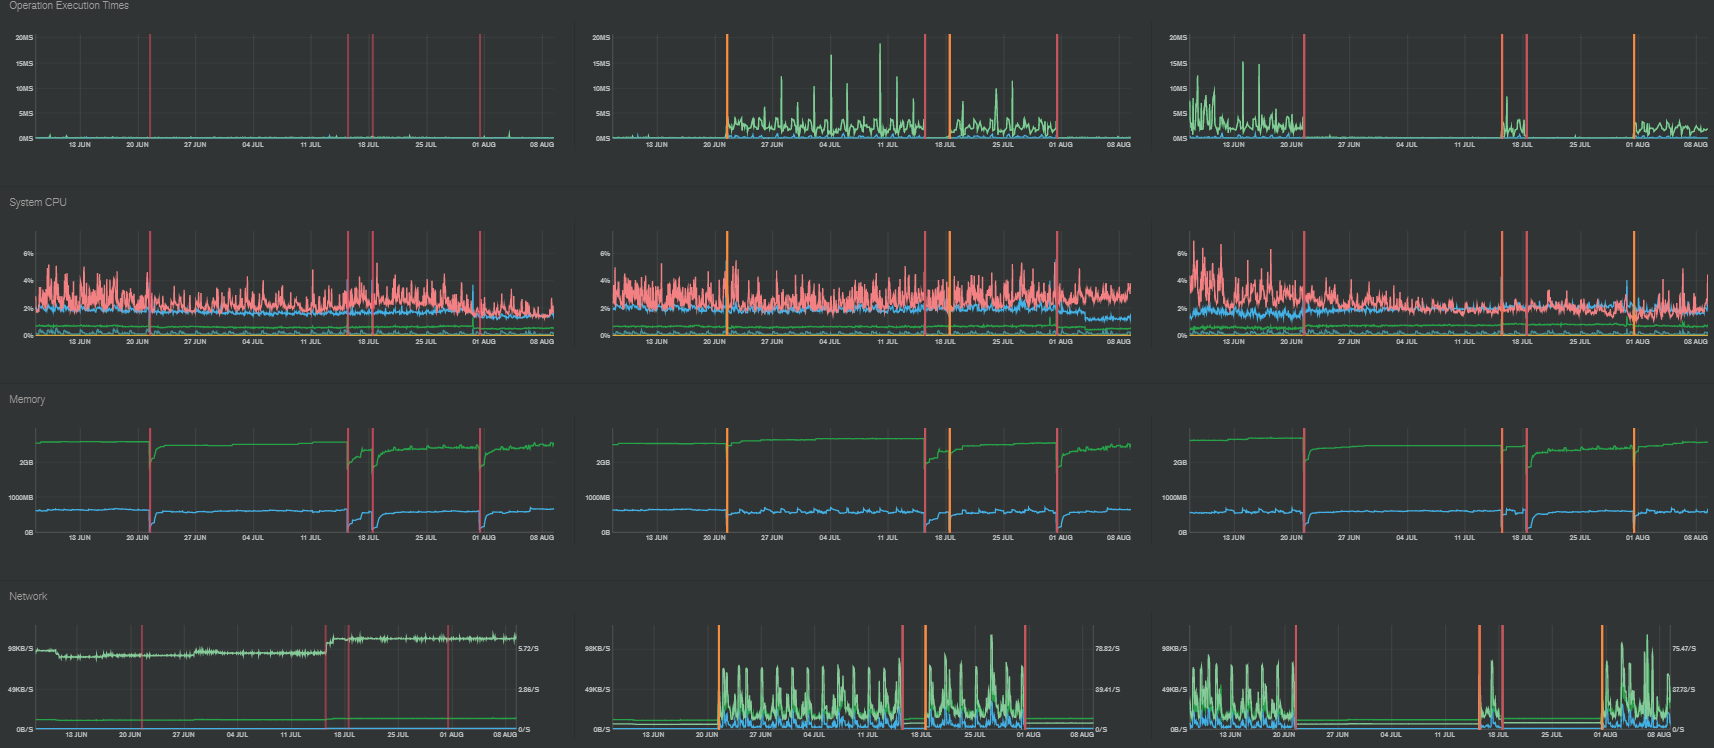
As you could see, it doesn’t appear that there’s any significant changes, nor does it look like the problem that began on Friday is even visible on the graphs?

Here is an image of our Galaxy APM, and you can see the DB clearly beginning to lag behind around 8AM (when we begin using the software).

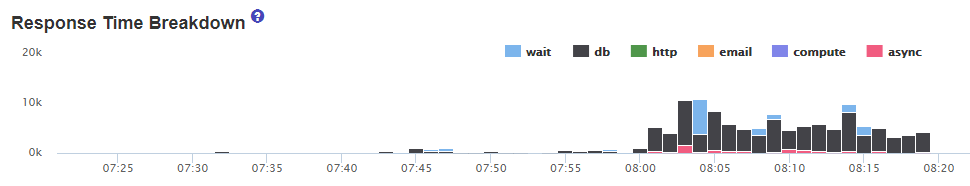
Taking this in to consideration, it seems a problem that is certainly worse when others are using the application. But all of our subscriptions, data usage, etc? It hasn’t changed at all! I’m not sure where to even begin on solving this problem, as based on our past experience, it should still be working the same. Our data usage hasn’t increase, we haven’t had an increase of orders, nothing has changed?

I have no idea what could be causing stress from connected clients. It doesn’t look like anything abnormal in our APM (aside from extremely high response time). It’s difficult to debug as the highest response time methods seem to be ones that are typically extremely fast - it’s as if when this problem occurs everything has a huge response time, and it doesn’t seem to be linked to any specific method or function that I could find,

MongoDB Atlas support has been friendly but has not been useful in resolving the problem yet. The first thing they mentioned was CPU Steal - which I’m not sure why it’s using CPU Steal anyway if we’re on a M10 plan and using such low CPU% - and as you can see in the logs I posted the pink line on the graph is CPU steal and that has NOT changed significantly.

Then Atlas Support chose a few specific methods saying that they may not have been indexed - but these were some rare cases where for example, a manager had searched logs to pinpoint a specific log and it didn’t fit under an index. These slow queries only happen a handful of times per hour, and I don’t believe they are the cause of this issue we’re seeing, as again, the indexes have not changed ,database usage has not changed, etc.

The issue here, for both support and ourselves, is nothing seems to be appearing on our MongoDB Atlas graphs. No differences in performance, response time, etc, if we compare when we’re having issues to when we’re not. Resources are mostly free.

But if I check logs, even the optimized queries are all appearing in slow queries during this time. A shot of our “profiler”:

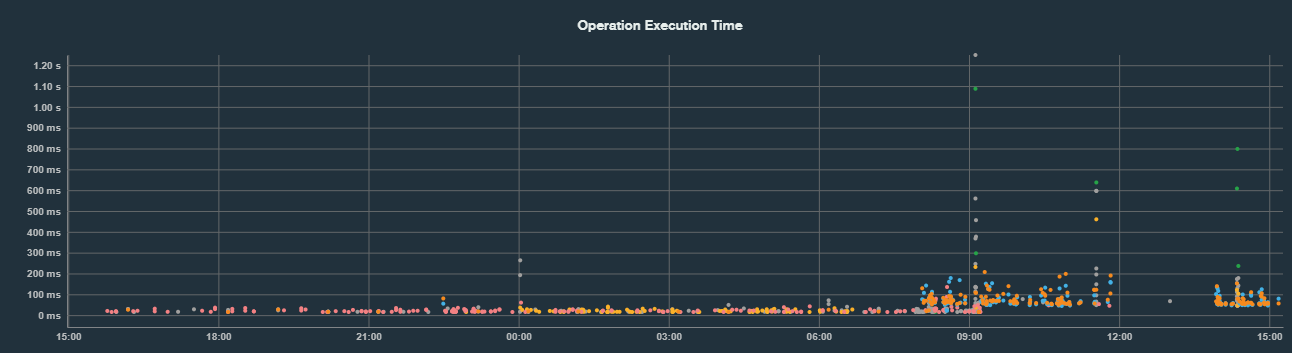
You can see the handful of manual searches there with high responses, that’s fine. But you can see as soon as 8AM hits, every single query begins taking much longer. (And to bring some understanding, at midnight/overnight we have some API routines that run, and that ends prior to 8AM. So some usage overnight is normal. My main point is that you can see all the queries begin taking much longer as of 8AM.)

I had attempted to restart the Atlas database, but when I try following the documentation to do so, the option to restart isn;'t there. I asked support about this, and no response.

Furthermore, while the response time for those methods is high, it’s nothign compared to what we see on our end. Even pages without any data subscribed nor any methods take 30 seconds to appear when only using general login/user access.

And the last 12 hours for the Profiler have slow queries by collection, and the total sum are as follows:

10, 9, 4, 3, 2, 2, 1 second respectively by collection

So according to this, around 30 seconds of response time was logged in the “slow queries” of the profiler. Meanwhile, our Meteor APM shows instances of over 91 SECONDS DB time , on single calls!

None of this is making sense to me. As again, we haven’t made any changes, the graphs of MongoDB Atlas don’t show any changes, nor do they show any major differences (although we could FEEL a huge difference!). Atlas support is pointing at optimizing slow queries, wehn those are rare cases of manual searches and aren’t realistically going to help. APM isn’t showing anything abnormal aside from a huge DB time.

I don’t really know what to do to diagnose this further. No publications/subscriptions stand out as a problem, it doesn’t seem linked to any specific methods. All signs seem to point at the database, but the database doesn’t even show anything that is a problem…?

1 Like

Check out this thread / comment made by @waldgeist and backtrack to other comments from there. The final conclusion was that unfathomably, some clusters in MongoDB Atlas just get broken, and that results in a horrible performance.

I’m not 100% sure that what you experience is caused by the same phenomenon, but it sounds like it could, and testing it would be fairly easy.

3 Likes

As Peter already pointed out, I had a similar problem that went away after I setup a new cluster and moved my data there.

(Currently, I am seeing another issue, though. I am frequently getting warning emails that the scanned / returned ratio has gone above 1000. Funny enough, this even happens if all relevant keys have been indexed and nearly no load is on the server. Because the app is running fine, I didn’t care enough to do a deep dive again.)

2 Likes

I have the same problem about atlas alerts. We inspected all the logs and profilers and indexes and they all looks that our query is well written so I don’t understand these emails.

1 Like

Glad I am not alone :slight_smile:

This happened to me as well about a year ago when I tried deploying to AWS Beanstalk. This issue has been discussed here: Slow oplog tailing on Atlas · Issue #10808 · meteor/meteor · GitHub

Sorry to hear about the troubles. Just to double check did you update any packages around the time that the trouble started (just in case that we could pin point it to something in Meteor).
From what @waldgeist and others have suggested it might be a good idea to check the MongoDB forums if something there might not help:

We have the warning issue too (performance is great though - no complaints there). I increased the threshold of the alerts but they’re still almost hourly. The issue linked by @vooteles is really interesting (and of course stalebot / meteor have closed it :see_no_evil:). I wonder if @seba got any further info from Atlas?

This is a very interesting issue, indeed. It might also explain some other weird behaviors I am facing: First off, sometimes in the past Methods never called their callback (which is also mentioned in the thread), and secondly, I noticed that sometimes the update DDP message is not sent to my Unity frontend if the user logs in. Also this behavior is described in this thread. Glad you referenced it! This might actually explain a couple of weird stuff.

EDIT: I just decided to create a new issue for the closed #10808. I think it’s worth looking into the whole complex.

1 Like

The more I think about what that scenario with the ‘update’ not arriving the more I think we’ve experienced it a few times over the years. We call a lot of methods within a sweetalert promise and have gotten to a stage where the methods were completing but the sweetalerts not dismissing. The only way we could fix it was by restarting the server.

Here’s a link to @waldgeist issue 11578

2 Likes

Thanks for linking the issue, forgot about it :slight_smile:

As I described in the issue itself, in our case the missing update leads to a pretty unreliable login behavior, because mainly (or even only?) the login method seems to be affected. And interestingly, we notice this mainly on Android, not on iOS. Sometimes, our (Unity) client takes about 3-4 attempts to login because of that. I was even thinking about implementing a hack that auto-receives an pseudo update on the client-side, but that would cause other issues.

1 Like

What about this hack/workaround here? It was posted in a comment to Slow oplog tailing on Atlas · Issue #10808 · meteor/meteor · GitHub

It says…

Meteor.apply` fixes ‘Meteor.call’ not calling DDP “updated” msg on production environment for active subscriptions.
– This caused method callback to never fire.
– The root cause for the missing ‘updated’ msg is unknown. It seems related to the oplog collection stalling.

For what its worth and I know it’s a very unpopular opinion here but I have always had these kind of experiences when using hosted services and the only way I have fixed it is by owning rack space and owning dedicated hardware outright and tuning ulimits and kernel settings. I cannot say virtualization has worked at all in my use cases, in fact it’s been a big hindrance. Give me a dedicated quad core and it will ruin a 16 cpu cloud instance. You may see the cpu’s available in top and /proc, doesnt mean it actually gives same performance even of a home gaming pc.

1 Like

I do not know if this can be related but I have lots of

Error, too many requests. Please slow down. You must wait xx seconds before trying again.

I do not know why, it seems to happen some times to times, which cause passwordLess login not to work sometimes.

Will watch this thread and issue,

Won’t work for me, as we’re using a Unity client.

That might be a different issue. We have specific handling for this for different methods. Our last remaining issue is related to the built-in login resume of Meteor (not sure if that is the same password-less error that you are mentioning)

This is pretty much the same as in passwordLess I use GitHub - meteorhacks/inject-data: A way to inject data to the client with initial HTML to add a token client side so that I can do to loginWithToken that is the same as the resume login in meteor

If you have control over that method call, then you can also debounce that event. Another way is to increase the frequency of allowed calls for that method. In our case, most issues are solved by debouncing from the client side or ensuring that unintended re-rendering of components are not causing multiple method calls. For the case that it is expected that frequency to be high per client, then we asjust the ddp rate limit for that method.

2 Likes

See our comment here please Slow oplog tailing on ATLAS (reactivated issue) · Issue #11578 · meteor/meteor · GitHub

1 Like

See our comment here please Slow oplog tailing on ATLAS (reactivated issue) · Issue #11578 · meteor/meteor · GitHub

Hello and thanks for all the replies!

I had a phone call with MongoDB Atlas support today and we reiterated that we can both recognize the issue, but since nothing is appearing on the database statistics side, it’s hard to pinpoint what is going on. We’re still testing a few things, but haven’t had any success yet.

@filipenevola - We already have Redis Oplog enabled on our project. This issue is still occuring.

One strange thing we noticed on the call is when the performance degradation occurs, the Galaxy APM is showing a very high response time not only on methods, but also on pub/sub. If we’re using Redis Oplog, shouldn’t the response time for pub/sub stay low based on the redis server? I’m not 100% sure how Redis Oplog appears in the APM.

1 Like