So I am looking to implement a simple data visualization app that allows the user to input the query via a form and then on the backend query the data in mongo and render the information to a graph .It must be reactive to the user input. And rerender the graph when the parameters change.
Taken from the http://api.population.io/
  {
    "females": 128443,
    "country": "Afghanistan",
    "age": 18,
    "males": 134463,
    "year": 1980,
    "total": 262906
  },
So this is a sample data-set
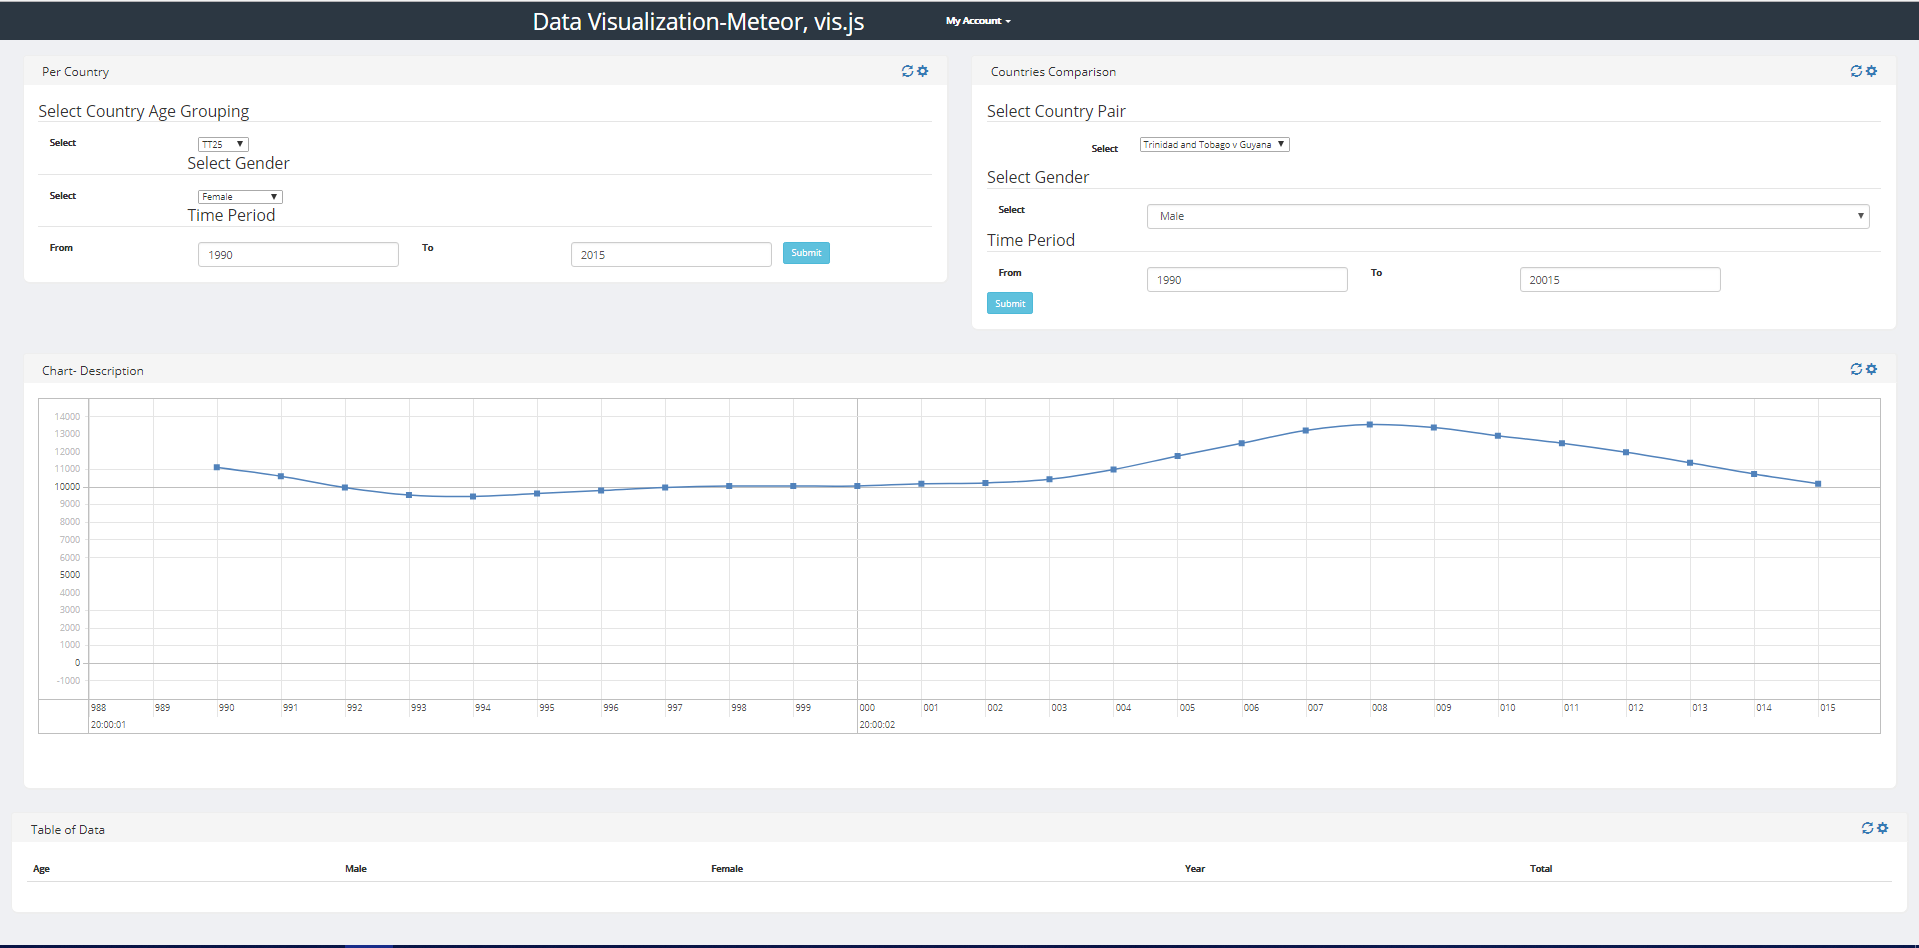
I was able to implement this using meteor/blaze and visjs…
But with React I ‘m not sure how to implement it. Nothing fancy just render a graph of the saved data set based on the set of visualization options provided by the app like “give me all the males in Afghanistan over the period 1980-2000”.
With my primitive knowledge I was able to implement this with meteor/blaze and visjs but with react not sure. Please guide me …
Here a screenshot of app (METEOR@1.3.2.4)