Hi, one question about this: I have used npm to install mupx. How do I make a custom build once I fork it?
How… How did you do this please ? My server memory on AWS is just keeps on rising… so like every 2nd day I have to do a restart to drop it…
I would also be interested in a detailed description - I did not dare to do such a fork myself.
@sahandissanayake47: I’ve opened an issue on Github to support the garbage collection option in mupx directly. Maybe you would like to join this? https://github.com/kadirahq/meteor-up/issues/124
Yup for sure… Subscribed to the thread… Looking forward to seeing a solution for this
Hi guys,
Opening the issue on MUPX seems like the way to go. I don’t use MUPX at all so wouldn’t be able to test the solution for you.
I do, however, have a new way around these issues… have you tried Galaxy?
I’m finding it really easy to use, with no deployment problems. Migration was scary but turn out to be painless. The best bit is that the containers will reboot by themselves when encountering problems, and the requests get transferred to your other containers. As a result I’ve been able to run for a week so far without worrying about having to be around to manually reboot broken servers. Also the servers are responding quickly even at high memory use, which certainly wasn’t the case on Heroku (seemed to slow down A LOT for GC).
For Heroku uses it’s also a boon as there’s no 60 second boot time-out rule (which really sucks once your app gets beyond a certain complexity). And though expensive, is within 5% of Heroku’s cost. Plus you’ve got the safety net of a support team who know Meteor (they reply in about 1 day or so).
1 Like
I experience the same issue with our product. However, we didn’t use meteor-up to deploy the app, but just run it in the development mode (using meteor command to trigger the server). How can I set the flag in order to increase the heap and the gc interval. I am looking around the meteor bash file and discover the line
exec "$DEV_BUNDLE/bin/node" ${TOOL_NODE_FLAGS} "$METEOR" "$@"
in the end of the file, do I have to set the TOOL_NODE_FLAGS="–max_old_space_size=920 --gc_interval=100" before trigger the meteor command ?
Also, how do I know the current heap and gc interval of the meteor in order to adjust it correctly ?
Edit: I just set the flag on my machine. Look like setting the TOOL_NODE_FLAGS="--max-old-space-size=3000 --trace-gc --trace-gc-verbose" meteor works !!!
1 Like
Reviving this old thread. I have my backend app deployed on Galaxy and the problem persists there. The server just restarted.
How can I increase the heap and gc interval on Galaxy?
@a4xrbj1 Same issue popped out of nowhere with one of our Galaxy deployments, managed to fix it with:
TOOL_NODE_FLAGS="--max_old_space_size=4096" meteor deploy yourapp.meteorapp.com
2 Likes
It just crashed again, the parameters unfortunately didn’t help
Trying now with these parameters:
--max_old_space_size=920 --gc_interval=100Hi, I tried earlier to set the GC settings “–max_old_space_size” to fit the size of instances I’ve deployed but it didn’t help so I’ve just started a new thread Memory Leak - App crash every day
I’ve added many screenshots from meteor apm and maybe someone can help me reading the graph to understand where this memory leak comes from.
It becomes a nightmare and makes the app crash every day… not really convenient for our users. thanks for your help
1 Like
We see that in our app as well. Main cause was globals that we used, since we eliminated them it’s been stable when no activity is happening but we have memory leak problems on MongoDb queries
Just for the record, we are experiencing those memory leaks on production which runs on Meteor Galaxy
1 Like
How did you work out it was the globals?
What did you mean by memory leaks in the Mongo queries? What was wrong with them?
For me, the problem seemed to be the old NodeJS version Meteor used before the more recent NodeJS switches. Those had problems with garbage collection running not often enough. Since I switched my servers to 1.5+ (I think), I don’t see any server breakdowns anymore. (However, this might also be related to my switch to the zodern:mup, which restarts the server automatically if things get wonky.)
1 Like
If you’re using React, avoid using componentWillMount, use componentDidMount instead.
Getting geolocation during componentWillMount caused a memory leak for me
How can this cause a memory leak on the server?!
2 Likes
We did a lot of tracing, writing down into our own performance collection (with heap difference etc before and after, hence we could find out where it happened).
But there might also be a positive effect from newer versions but since we’ve solved it the hard way by writing better code, I don’t know the effect of the newer NodeJS version.
We also triggered the garbage collection process manually which caused our backend to stop for the time being. That was avoiding the crash but slowed things down a lot.
Since we switched to AWS self hosting we also don’t have to give any GC parameters like we used to have to do with Galaxy like these:
TOOL_NODE_FLAGS="–max_old_space_size=4096 --gc_interval=100"
Please note that we’ve run the smallest box at Galaxy and that made these effects more visible as you can run out of memory a lot faster than on bigger boxes.
I was using SSR too.
1 Like
Ok, I understand 
Bumping what I’m hoping is the most relevant thread on this. Over the last two weeks, my app has had two instances where a container on Galaxy starts crashing and restarting every 2 minutes. The moment it restarts, the cycle repeats itself.
Trying to figure it out, I’ve made an educated guess that because it seems to be just one container that goes down and restarts, the source of the issue is from a SINGLE client connection.
If that is the case, are there any clear troubleshooting steps I should take to try and find what part of the code is causing this?
Other random points:
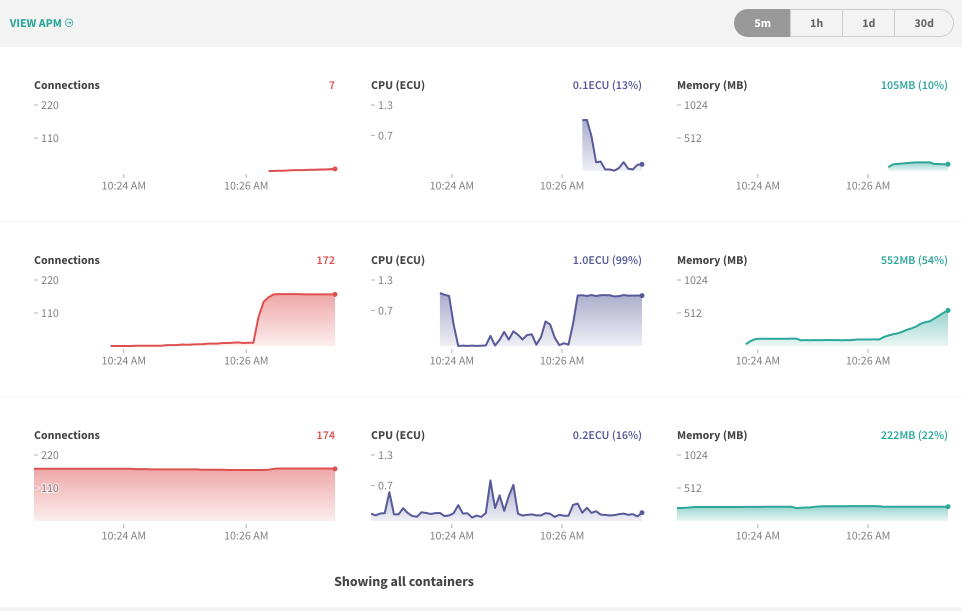
- Continuing on from the hypothesis from above, whichever server that the rogue connection gets transferred to when the server goes down, ends up also spiking and crashing:
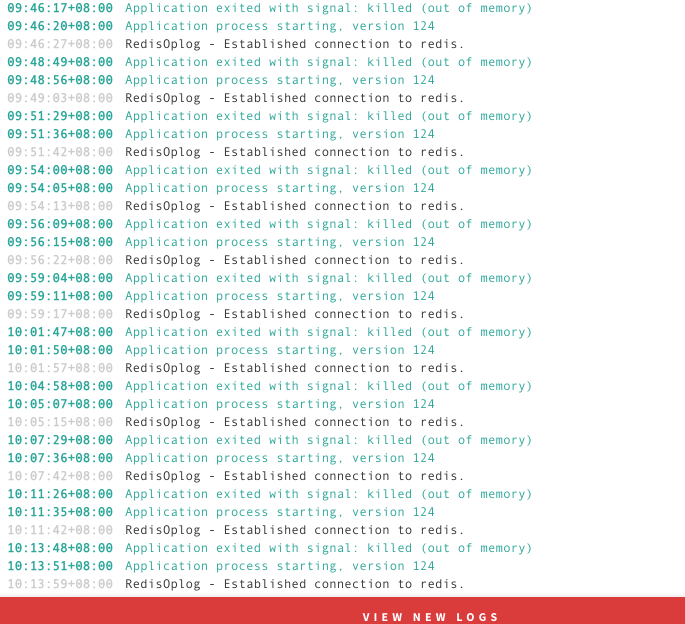
- The logs simply show an out of memory message, nothing to indicate what/why
- The first time this happened, after about 30-40 minutes of constant restarts, the issue went away (I imagine the client disconnected or stopped doing whatever was causing the issue)?
Example pic, about a minute after the previous crash:
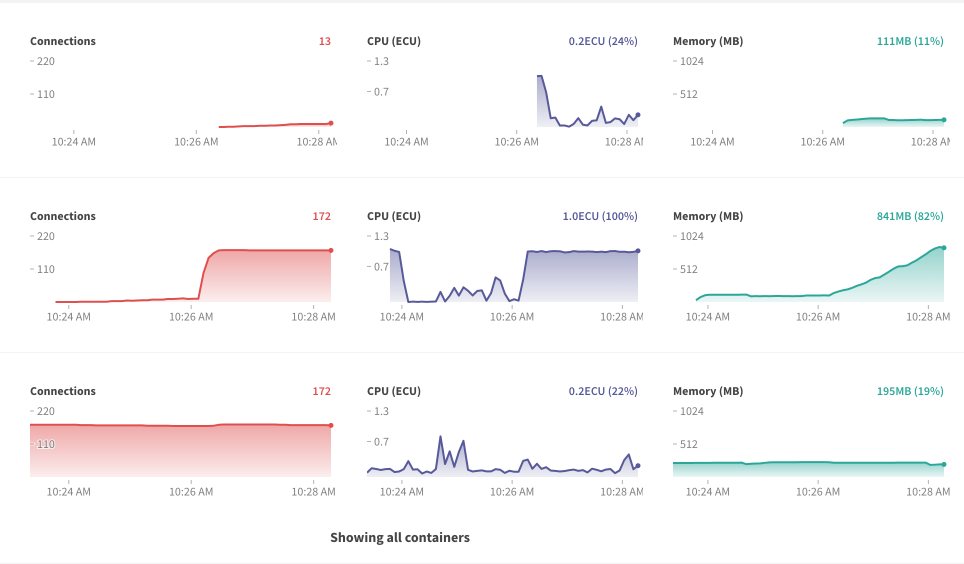
Approx 60 seconds after that:
Does anyone have any ideas I can try and tackle this? Or how I can try and recreate this on my local?
Thanks in advance!