My server on Amazon goes down every couple of weeks, and I have been hinted by the mupx team that this might be caused by a memory leak. And actually I can see on Kadira how the memory gradually increases over time. But how can I analyze this further? Strange thing is, I don’t see this memory consumption in my local development app, it only occurs in the deployed app. Any hints how to track this down? Thanks.
2 Likes
Likely, you have an unended observer if I have to guess, check your publications.
I join the question. How to track what’s going on with mongo? I’m rewriting the app from blaze and meteor 1.2 to 1.3 and react. Today observe that moment, the same app, but the react version, with 100 mongo subscriptions, becomes really slow. Respond from a server comes in 20-30 second and it’s on localhost. Then tried to run an old blaze versions and there, with the same amount of subs, it goes absolutely normal, few second to respond or less.
I thought that it could be reactivity delivery system and switched from tracker-react to react-komposer and it seems as no differences between. How to track all that stuff? What could be wrong?
Thanks for your reply. The question is: What to look for? I am using standard publications only, i.e. ones that don’t use the low-level pub/sub API. Can unended observers occur in this case, too? How can I avoid this?
2 Likes
I’d like to bump this question, since I still have no clue how to track down memory leaks. In my case, the memory consumption of the app goes up constantly even if no user is using it for a longer period. Even if the root cause should be a misbehaving pub, shouldn’t Meteor drop this once the session times out? Any help is appreciated. I can literally watch the memory go up on Kadira over the period of 1 day.
1 Like
What’s the order of magnitude it going up? Is it 10 MB daily? 100 MB? More?
I don’t see that in my app, it usually starts around 180 MB, goes up a bit and then when the traffic is lower (during night) it jumps back down below 200.
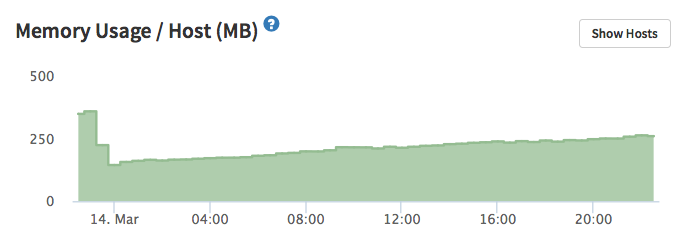
Thanks for answering. If I restart the server, the memory consumption starts with about 140 MB. Over the course of one day, it nearly doubles to 260 MB. And this trend won’t stop, so after about 2-3 weeks, the server stops responding due to overload - I can’t even SSH to it (it’s an EC2 machine).
Below is a typical screenshot of Kadira’s monitoring tool. You can clearly see the time-point when I restarted the server. I’m doing this regularly now, but this is just curing symptoms. I really would like to find the root cause.
2 Likes
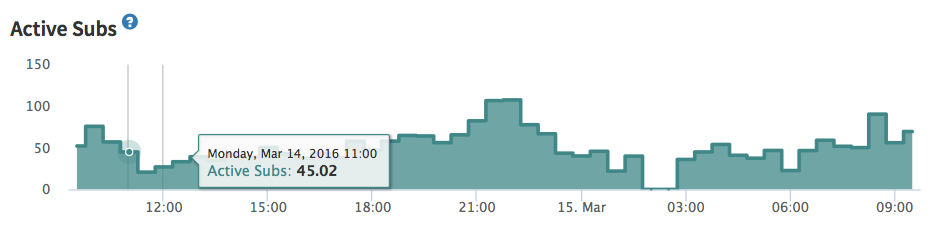
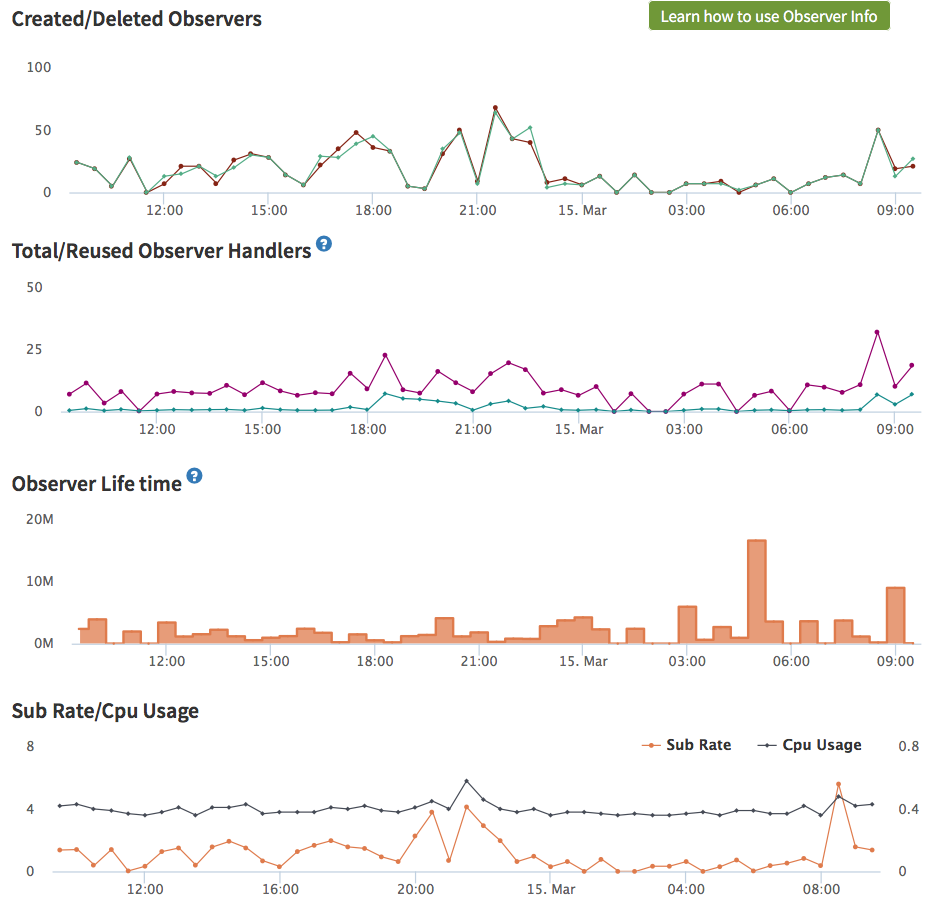
What about other metrics? For example, “Active Subs” in Pub/Sub tab? And especially - Observer Info metrics in “Live Queries” tab?
I see a similar pattern on my production app but it goes up ever so slowly that so far it’s not been an issue. Every time I restart it goes back down and then sneaks up again. Would be very interested to hear if there are good methods to track down the culprits.
2 Likes
I’m having a similar experience. Memory usage goes up gradually, eg 10-15mb/day. Even with no clients connected.
My created/deleted observers chart looks just like yours, with creations being balanced by deletions. After that, I’m not sure what to check.
It hasn’t been much of an issue yet given the gradual pace but I’m worried that I’ll be forced to restart every so often
2 Likes
All these graphs seem normal to me (but I’m not an expert, so maybe some Kadira folks will chime in). So maybe this is really an issue with either Meteor itself, or with one of packages that you’re using?
If you can, try to deploy a test version of your app and gradually remove packages from it. Maybe you’ll find the culprit.
The way to detect the cause of a potential memory leak would be to take a memory snapshot and inspect it using chrome developer tools.
Here are some nice articles describing how you can do that:
- https://www.toptal.com/nodejs/debugging-memory-leaks-node-js-applications
- http://www.nearform.com/nodecrunch/self-detect-memory-leak-node/
- http://blog.yld.io/2015/08/10/debugging-memory-leaks-in-node-js-a-walkthrough/#.Vuf_XWF96kA
It may not even be related to publications!
7 Likes
At least on my t2.micro instance, it becomes an issue after about 2-3 weeks. After that time, the server overload becomes so heavy that the server won’t respond anymore. Although the EC2 console states no errors, I cannot even connect to the machine via SSH. The only solution is to stop and restart the instance. Which is annoying, because I’m not using Elastic IP so far and the server will get another IP then.
This happens on two different machines actually, one for staging, one for deployment.
Thanks for sharing these links!
I’m not sure if I am able to apply this to the dockerized mupx-installed instance, though, since my knowledge about the internals of this setup is somewhat limited. I would have to do it on the prod machine, since the problem does not occur on the local server on my Mac.
You could npm import memwatch and heapdump into your application, and have it dump the snapshots to somewhere you can download (s3 perhaps) using the methods described on the nearform.com article and redeploy the application, generate some load, and see what happens.
it would basically be a very very very glorified console.log() 
4 Likes
I’ve been having out of memory issues on production since yesterday on my Heroku servers (which run on Amazon EC2).
Here’s a completely different tack - try adjusting nodejs’s garbage collection limit?
node --max_old_space_size=920 --gc_interval=100 main.js
Apparently node’s garbage collection is very lazy, and by default assumes a 1.5GB limit. So on smaller boxes like a micro instance it might be problem.
I know it’s for Heroku, but I think it might apply to you. See here: https://devcenter.heroku.com/articles/node-best-practices#avoid-garbage. Also https://blog.risingstack.com/finding-a-memory-leak-in-node-js/
I’m trying it over the next few days. The flag has definitely changed the memory usage of my app, though I’m still hitting the swap disk it is much less often, so might tighten it to see what happens.
Would love to hear the solution you end up with. All the memory heap debugging options sound hard, also if GC is the problem might actually be a red herring.
5 Likes
Will a mupx restart not give you the same result? I’ve never been too bothered because every time I do another mupx deploy it drops back down.
Actually, I recently (two days ago) updated this app for the first time since November and replaced Iron with Flow and mup with mupx. So far it seems to drop a little more when sessions finish, but never by the same amount it increases. Let’s see how it pans out over the next few weeks.
This seems to make a lot of sense. The question is now, how I can apply these settings to the dockerized Meteor container mupx is setting up? Unfortunately, I don’t know the internals of this setup. It’s more or less a black-box to me.
I don’t do unix and I’ve never used mup/mupx before, but being the shameless hackr I am,  I suggest you fork a change to this file:
to read something like:
node --max_old_space_size=920 --gc_interval=100 ./app/main.js
No warranties provided 
4 Likes