Ok, I understand 
Bumping what I’m hoping is the most relevant thread on this. Over the last two weeks, my app has had two instances where a container on Galaxy starts crashing and restarting every 2 minutes. The moment it restarts, the cycle repeats itself.
Trying to figure it out, I’ve made an educated guess that because it seems to be just one container that goes down and restarts, the source of the issue is from a SINGLE client connection.
If that is the case, are there any clear troubleshooting steps I should take to try and find what part of the code is causing this?
Other random points:
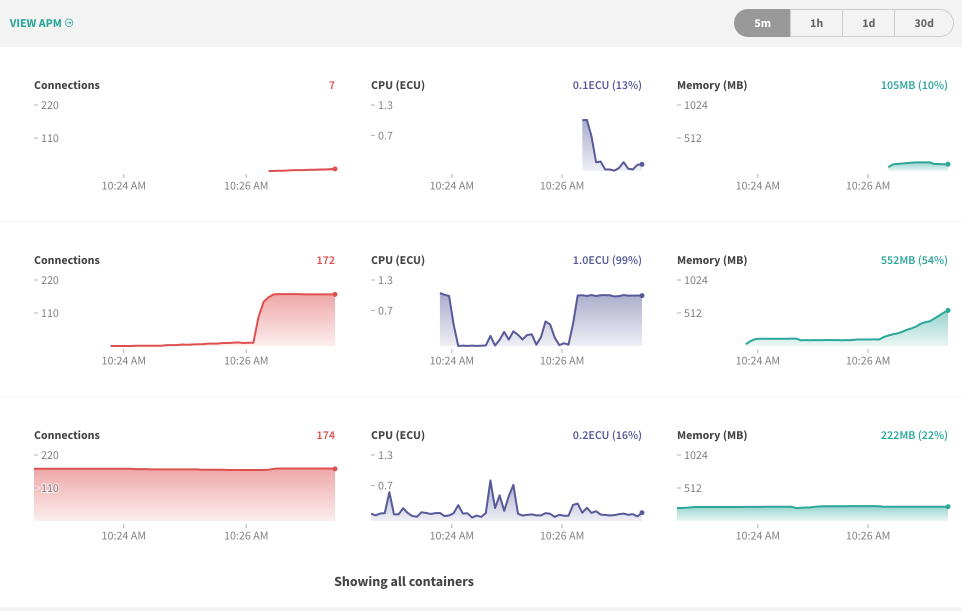
- Continuing on from the hypothesis from above, whichever server that the rogue connection gets transferred to when the server goes down, ends up also spiking and crashing:
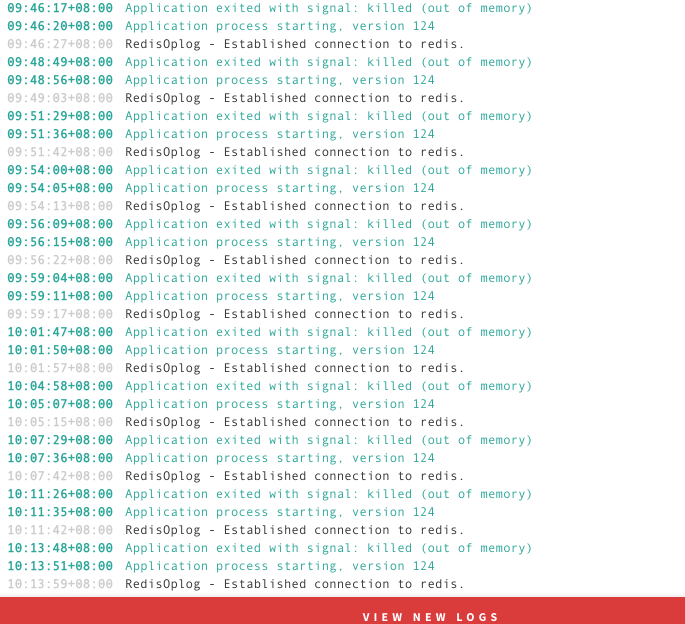
- The logs simply show an out of memory message, nothing to indicate what/why
- The first time this happened, after about 30-40 minutes of constant restarts, the issue went away (I imagine the client disconnected or stopped doing whatever was causing the issue)?
Example pic, about a minute after the previous crash:
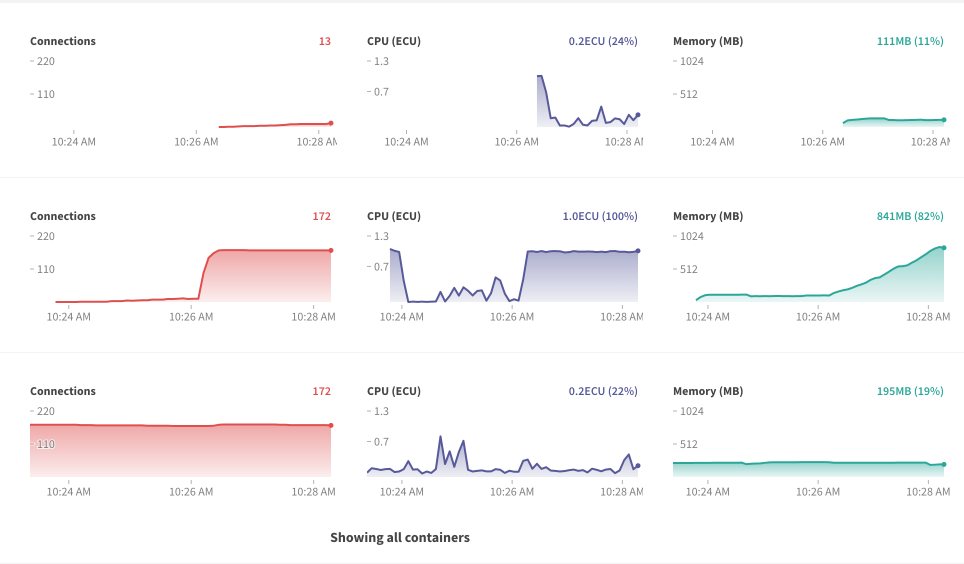
Approx 60 seconds after that:
Does anyone have any ideas I can try and tackle this? Or how I can try and recreate this on my local?
Thanks in advance!