I would like to use helpers to get the wanted data from collections and load these data into a chart. Now, I don’t know how to properly define and pass these data to onrendered hanlder, since I got these two errors: Exception from Tracker afterFlush function: and ReferenceError: data is not defined
import './visual.html';
import { subject,student,record } from '../../lib/collections/collection.js';
import { Chart } from 'chart.js';
import { Template } from 'meteor/templating';
Template.charts.helpers({
charts:function(){
//To get the attendance rate for each student who has been attended classes
var studentIDList =[];
var studentArray = [];
var numOfStudent = student.find().count();
var studentDoc = student.find().fetch();
for(let i = 0; i<numOfStudent; i++){
studentIDList.push(studentDoc[i].studentID);
}
for(let x = 0; x<numOfStudent; x++){
let item = studentIDList[ x ],
exist = record.findOne({studentID:item});
if(!exist){
//console.log("Student record not found");
}else{
studentArray.push(item);
}
}
var data =[];
for(let x = 0;x<studentArray.length; x++){
let totalRecord = record.find({studentID:studentArray[x]}).count(),
attend = record.find({studentID:studentArray[x],attendance:true}).count(),
rate = attend/totalRecord;
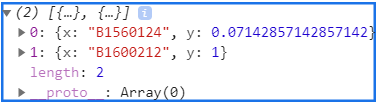
data.push({
x:studentArray[x],
y:rate
});
}
return data;
}
Template.charts.onRendered(function () {
console.log("The Bar Chart is rendered")
let ctx = $("#myChart");
this.autorun(() => {
let myBarChart = new Chart(ctx, {
type : 'bar',
data : data,
options: barChartOptions
});
});
});
});
It’s probably to do with data reactivity, when your chart is initiated, your data has not arrived from the server yet.
As softwarerero pointed out, your helper function is not currently being called, so the onRendered function does not have access to your data.
Can you post an example with your function in your onRendered function, and include your subscription to your data as well.
You can either include a reactive data source in your autorun, so your chart is reinitialized, once your data arrives, or you can wait for the subscription to be ready.
Have you tried searching the forums for chartjs? There are lots of posts discussing how to make reactive charts in Meteor with Blaze, React, Vue, etc. Also try searching for highcharts. The same principles may be used interchangeably with chartjs and highcharts.
ChartsJS has a way to update data after the chart has been created. You can run myBarChart.update() (see Updating Charts | Chart.js).
For the error you mentioned this is the line of code you need to consider:
You created the data variable within the helper function, so it is not within the scope of the onRendered ffunction.
I can’t remember how to access your helper chart from the onRendered function. However you’re using an autorun function, so actually you can move everything from the helper to the autorun, and it will be reactive.
I would move myBarChart to outside the autorun function (still within onRendered), and then autorun the data fetching as well as myBarChart.update().