So I am just curious about measuring the size and time spent loading my application upon system startup. And the client bundle’s size.
So i am running my app with the --production flag and I am using dynamic imports in my vue-router’s configuration file. When a route is navigated to, the associated component will then be loaded.
I can see in the network tab of the Chrome Dev tools that a JS file with the name of 5a5ce057a897fbe3c9113f48189c34a2d34f7c42.js?meteor_js_resource=true
has a size of 930 KB but only 285 KB has been loaded. So my question is, is that due to me dynamically loading components? and is 930 KB my client bundle’s size? when i use the bundle-visualizer tool the application has a reported size that several MB’s in size. So I am confused about what is the proper term for what I am looking at in both cases.
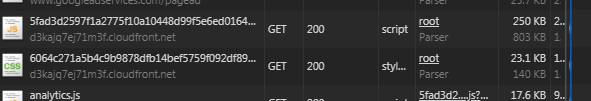
Where do you get the numbers 930kB and 285kB? The Chrome network tab shows two numbers, in my case:
The top number (250kB) is the gzipped compressed size of the data transfer, and the 803kB is the uncompressed size.
Is that what you are referring to?
In my case the bundle-visualizer reports a size of 737kB, I’m not sure why that differs from 803kB, but they should be in the same ballpark, not MBs different as in your case.
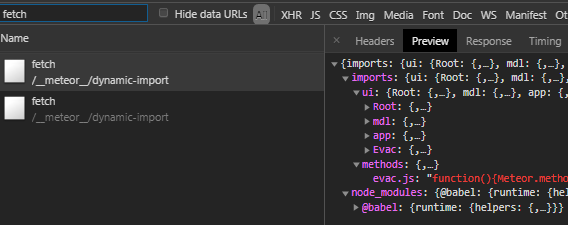
When using dynamic imports, the imported modules are loaded from /__meteor__/dynamic-import/fetch :
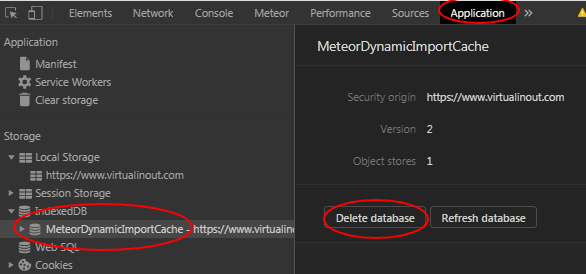
However, they are cached in the browser’s IndexedDB, so if you want to see the dyamic imports you either have to use a fresh Incognito window or delete the cache:
Yea i was looking at the compressed vs uncompressed values in the network tab. Thanks for clearing that up. Where did you see the value of 737KB in the bundle-visualizer overlay?
Thanks for info on the cached imports in IndexedDB too. I wasnt aware of that.
that is where i was getting the value that was a few MB’s in size. I will double check this when i get home tonight and just verify that tho. I don’t want to misspeak and cause confusion. so i will double check and post what i find
you were right … mine says 940 KB and that matchs what is in the browser. I cant figure out why i had the idea in my head that my client bundle was being reported to be roughly 2 MB’s in size. Even under the web.browser.legacy and web.cordova “tabs” of the bundle visualizer the size is about 1 MB. well thanks for walking me thru using that tool and teaching me a bit about dynamic imports. much appreciated