When I run bundle-visualizer it states that my app bundle is 3.6Mb. However, when checking chrome dev tools the js bundle is only 906Kb and on production deployment also. Also the chrome network tool states that the entire download with all assets when refreshing the page is 1.7Mb.
So I’m wondering where this 3.6Mb from bundle-visualizer comes from, and why does it not add up the same as the js bundle in production. Any ideas?
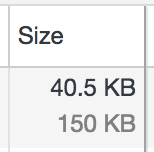
Are you looking at the compressed (Gzipped) size in Chrome’s Network Tools, or are you looking at the uncompressed size? The bundle visualizer shows the uncompressed size. For example, in the screenshot below, the bottom size is uncompressed and the top is compressed:
If you only see one number, you’re only seeing the compressed value. You can click the “Use large request rows” button to see both (and more information in general):
why is bundle not compressed then, or rather why network tab shows compressed numbers (for it’s cache?), is it standard practice to compress bundle on server for client?
The bundle is compressed. That’s why the 3.6Mb of javascript was only 906Kb over the network. It is standard practice for web servers to gzip assets before sending to the client