What’s the ratio of human code to vibe code here?
PS I’m not judging, just merely curios since I utilize agents a lot in my daily workflow
What’s the ratio of human code to vibe code here?
PS I’m not judging, just merely curios since I utilize agents a lot in my daily workflow
That is a lot! Looks like I will have to give it a try soon.
To be frank … I am quietly waiting for the OS release of Monti ![]()
Most of my workflow these days is about 90% agent-driven and 10% manual tweaks.
Over the last year, I jumped headfirst into agentic workflows—not just for coding, but for running company ops and all the admin stuff too.
I really think agentic workflows are the future for pretty much everyone, not only devs. That said, they’re not some magic fix-all; they’re just tools that open up the next level of abstraction. What sets things apart is still the thoughts and ideas behind them as agents get smarter.
I’ve put a ton of time into fine-tuning my prompts so that dozens of sub-agents match my coding style almost perfectly now. It helps that I’ve got a bunch of repos and big projects where I’ve written every single line myself (millions over the years), and I use those as examples in the initial prompts.
Funnily enough, that’s why I kicked off SkySignal—I nailed a fully agentic setup for local dev and wanted the same solution for DevOps.
My advice to folks: Don’t shy away from AI or agentic workflows.
Just installed - Thank you, this is really generous for the free tier. Setup was seamless.
I think the only feedback I have is - how do i get in to dark mode like on the homepage ![]()
Can this run alongside Monti or it’s one or the other ?
Any plans to add BullMQ to your supported jobs?
BullMQ +1
I also use this one. ![]()
Added BullMQ support to the roadmap.
BullMQ +1. It’s one of the most used queue systems in meteor world. probably because of redis-oplog
Who isn’t using BullMQ these days. It’s a life saver, would love to go Pro but their pricing is just ridiculous (for getting “groups” which is the feature I’m mostly interested in).
Having said that, I’m using the BullMQ dashboard in my Admin app and I have added statistics to see how long certain types of jobs are running and some other important stats on the queues (for me).
So wondering what exactly you guys want to see added to SkySignal in terms of BullMQ?
Hear, hear. Fully agree with you. As good as we are as humans, we can never be top notch in everything that a small software company has to offer (as jobs). Hence the Agentic AI comes in very handy. I also don’t need to read through endless pages of documentation to get things done that I’ve never done before (especially on the engineering side).
On that “vibe-coding” topic I think we need to distinguish clearly between “vibe-coding” - which is what these YouTube ads tell you “I don’t know how to code but I’ve just build an app/website” vs Agentic AI for coding. That’s a huge difference as we all know and the only common thing is the word AI in both ![]()
Just my two cents and keep up the good work @mvogt22 - this is some huge progress and some excellent new ideas that you brought to live. Excited to read about your agent Astraeus AI DevOps - that sounds the most promising thing so far.
So wondering what exactly you guys want to see added to SkySignal in terms of BullMQ?
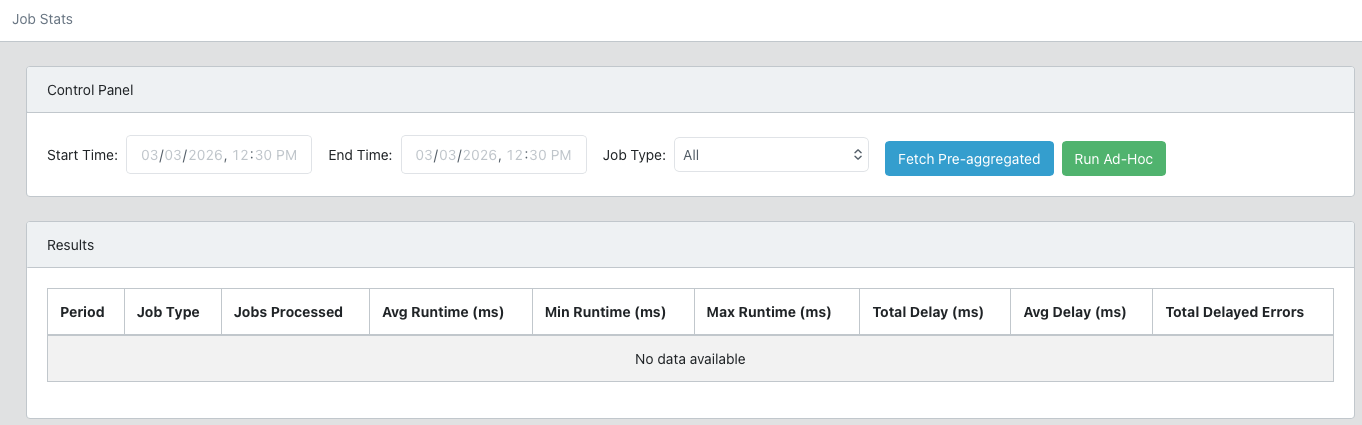
My use case is pretty simple—I just need a simple interface to check queue info (like how many jobs are executed per day). ![]()
That’s exactly what I let AI build in 15 minutes:
Customize it to your liking.
I’m not 100% convinced that such should be “automatically” be on SkySignal. The package will become bloated if the next person is then requested “Oh, I use Steve Jobs as a queue system, please add it as well” and so on.
Just my two cents ![]()
@mvogt22 check this out: Software engineers are going to love this! (open-source, 95% less production downtime) I found an open-source error monitoring agent that scans production logs, finds the root cause, and sends a… | Akshay Pachaar
This will be Astra AI (renamed from Astraeus) but dedicated for Meteor apps. Very cool to see!
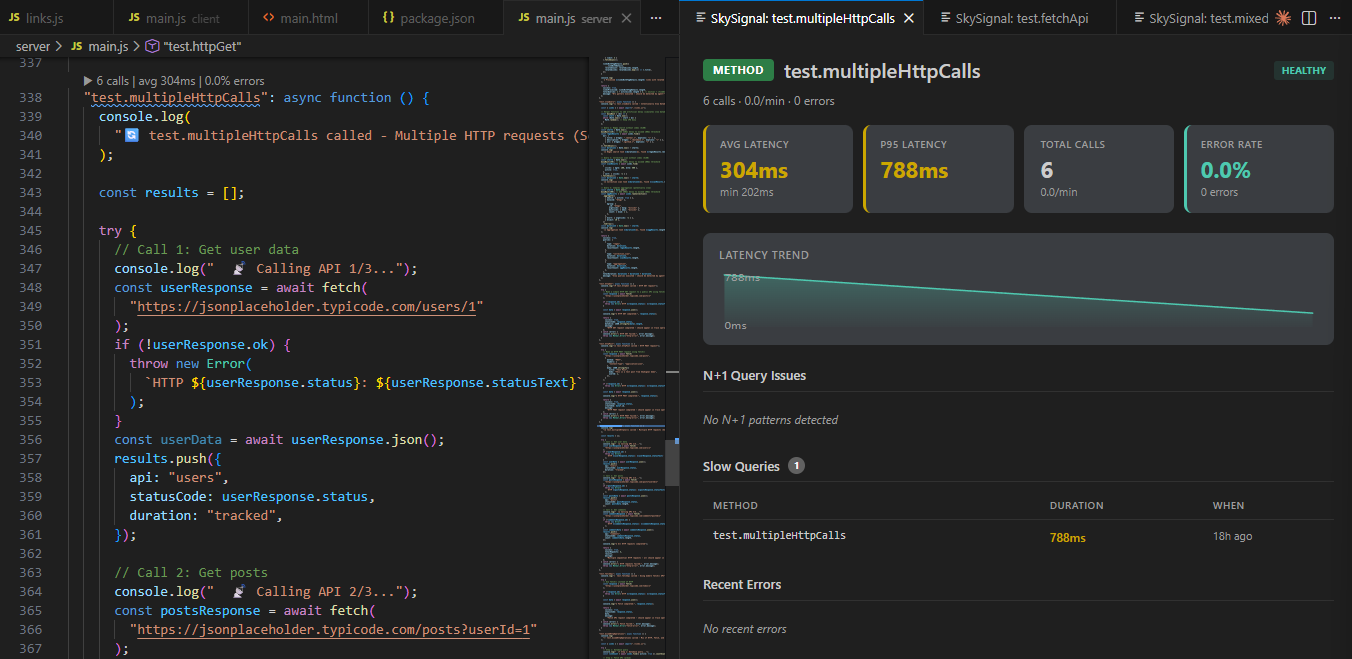
What you’re showing there is similar to what you can get with bullboard - you should try that out.
What we’d like to see in skysignal is more like what’s in monti APM - each job execution is fully instrumented like a method or publication so you can see everything in detail. Along with the typical stats like throughput / duration.
After many requests for BullMQ, v1.0.23 introduces support for it. Looking for users to begin testing it in their apps.
If you identify any bugs, please report them here.
Update your SkySignal config in your Meteor settings.json:
{
  "skysignal": {
    ...existing settings
    "collectJobs": true, // Ensure collectJobs !== false (it is true by default)
    "bullmqRedis": {
      "host": "localhost", // Redis host
      "port": 6379 // Redis port
    }
  }
}
When a bullmqRedis object is detected on SkySignal initialization, the jobs collector will automatically create a listener for BullMQ.
Read more about Background Jobs, or review changelog.
Hey everyone! It’s been a busy month. Here’s a rundown of what we’ve shipped across both the dashboard and the agent in March.
Agent Updates (v1.0.22 → v1.0.26)
We pushed several agent releases this month:
Dashboard Performance Overhaul
Almost every tab in the site detail view got meaningfully faster:
The result is that navigating between tabs should feel noticeably snappier, especially on accounts with a lot of data.
Ingestion Architecture Rewrite
We shipped a significant change to how the core platform processes incoming data from the agent.
Practically speaking: data from your monitored apps should show up in the dashboard faster, and the system is more resilient under heavy ingest load. We also removed a bunch of background jobs that were no longer needed, which reduces scheduler overhead.
Other Bits
Try SkySignal: It’s Free
If you have not tried SkySignal yet – get started in five easy steps:
settings.json file add: "skysignal": {
"apiKey": "YOUR_SECRET_KEY_GENERATED_FROM_SITE_CREATION",
"enabled": true
},
"public": {
"skysignal": {
"publicKey": "YOUR_PUBLIC_KEY_GENERATED_FROM_SITE_CREATION",
"rum": {
"enabled": true,
"sampleRate": 1.0
},
"errorTracking": {
"enabled": true,
"captureUnhandledRejections": true
}
}
}
meteor add skysignal:agentSee all available
settings.jsonconfig params here: Configuration | SkySignal Docs
Amazing work, Michael!
VSCode extension to view your Meteor app performance in-line with your Methods, Publications, Subscriptions and Collections – all without leaving your IDE.
I set out on the venture of building SkySignal with the goal of replicating the developer experience of local AI-driven development — the flow you get when you’re programming with something like Claude Code, where the agent reads your code, understands the problem, and proposes a change. But that experience stopped the moment you shipped to production. Once your app was live, the tooling and insights were limited to “old-school” workflows: stare at a stack trace, grep through logs, guess which query is slow, open a PR by hand.
To get to Agentic DevOps, the foundation had to come first. That foundation is SkySignal — a modern approach to Meteor application performance monitoring. The ingestion and data layer had to exist before an AI agent could do anything meaningful on top of it. Traces, errors, queries, publications, live-query observers, connection metrics, GC, event-loop lag, deprecated API usage, vulnerability scans — all of it had to be captured, indexed, and queryable.
That foundation is in place. And today I’m launching the thing it was built for.
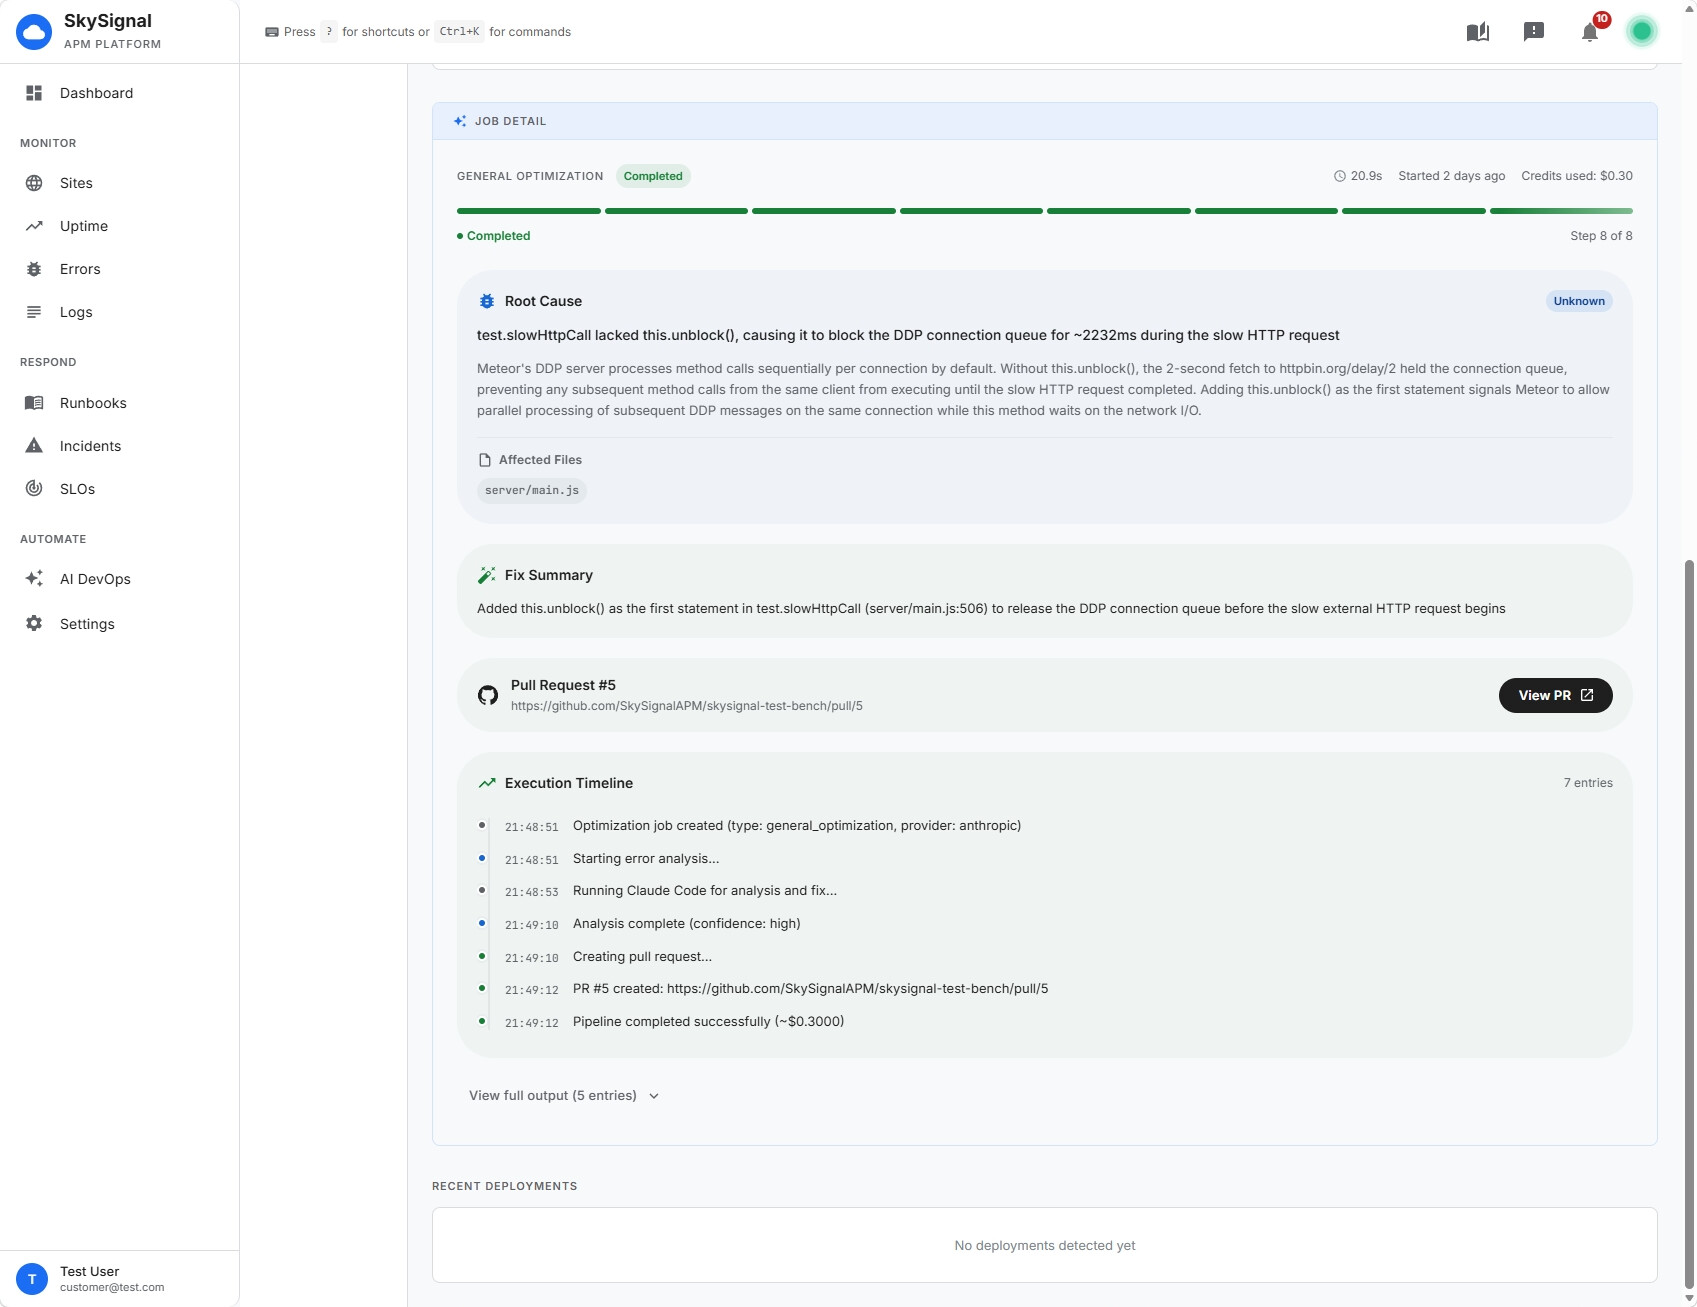
Astra is SkySignal’s AI DevOps agent. It reads your traces, finds the real bug, and opens a pull request with the fix, ready for review.
Astra doesn’t surface a suggestion and leave the next step to you. It takes the next step:
Analyze — reads the trace, the error context, and the Mongo query plan
Fetch code — checks out your repo through the SkySignal GitHub App
Fix — generates the patch and, where applicable, a regression test
Test & PR — runs your tests, pushes to a branch, and opens a PR against your configured base branch
You watch every stage in real time from the AI DevOps tab on a site. Status dots tick through queued → analyzing → fetching_code → fixing → testing → pr_created, and when it lands, you get a GitHub link to a PR that looks like a real engineer opened it.
Astra runs one of eight job types depending on what triggered it:
Error Fix — uncaught exceptions from the Errors tab
N+1 Fix — methods making the same query in a loop
Index Recommendation — missing indexes flagged by COLLSCAN
Query Optimization — slow aggregation pipelines and bad query shapes
Publication Optimization — over-fetching pubs missing field projections
API Migration — deprecated sync Meteor APIs (e.g. Meteor.call → Meteor.callAsync)
Vulnerability Fix — high/critical npm audit findings
General Optimization — ad-hoc performance work from a metric anomaly
Each of those can be triggered manually from a button in the relevant tab (Errors, Methods, Database, System → Code Health, System → Security), or automatically once you turn on Auto-Trigger with filters you control.
Astra is designed to be a trustworthy contributor, not a fire-and-forget automation:
Never merges its own PRs. Every change goes through your normal review workflow.
Never pushes to your base branch. Every fix lands on a new branch (astra/error-fix-abc123).
Respects branch protection. If required checks fail, the PR stays in draft.
Optional human approval gate. Flip on Require Approval and Astra holds every job at awaiting_approval until you confirm.
Exclude errors by regex so it never wastes credits on noise you’re already tracking elsewhere.
Restrict which job types run automatically. Start with error_fix and vulnerability_fix; add performance work later.
There’s also Watch Mode — a time-boxed auto-trigger that arms itself for the 10 minutes after each deployment. That’s the window where regression risk is highest, and it’s where having an agent that can diagnose and file a PR before your on-call rotation gets paged actually matters.
Astra is the headline, but a lot of the platform levelled up to make it possible. If you’ve been on SkySignal already, here’s what’s new:
A completely redesigned dashboard. The whole app got rebuilt from the ground up. It looks and feels like a modern command center for your apps — dense where you need data, calm where you don’t, and built around the way you actually move between sites, errors, methods, queries, and live diagnostics during an incident. If you’ve been away for a few months, log in and look around; it’s a different product.
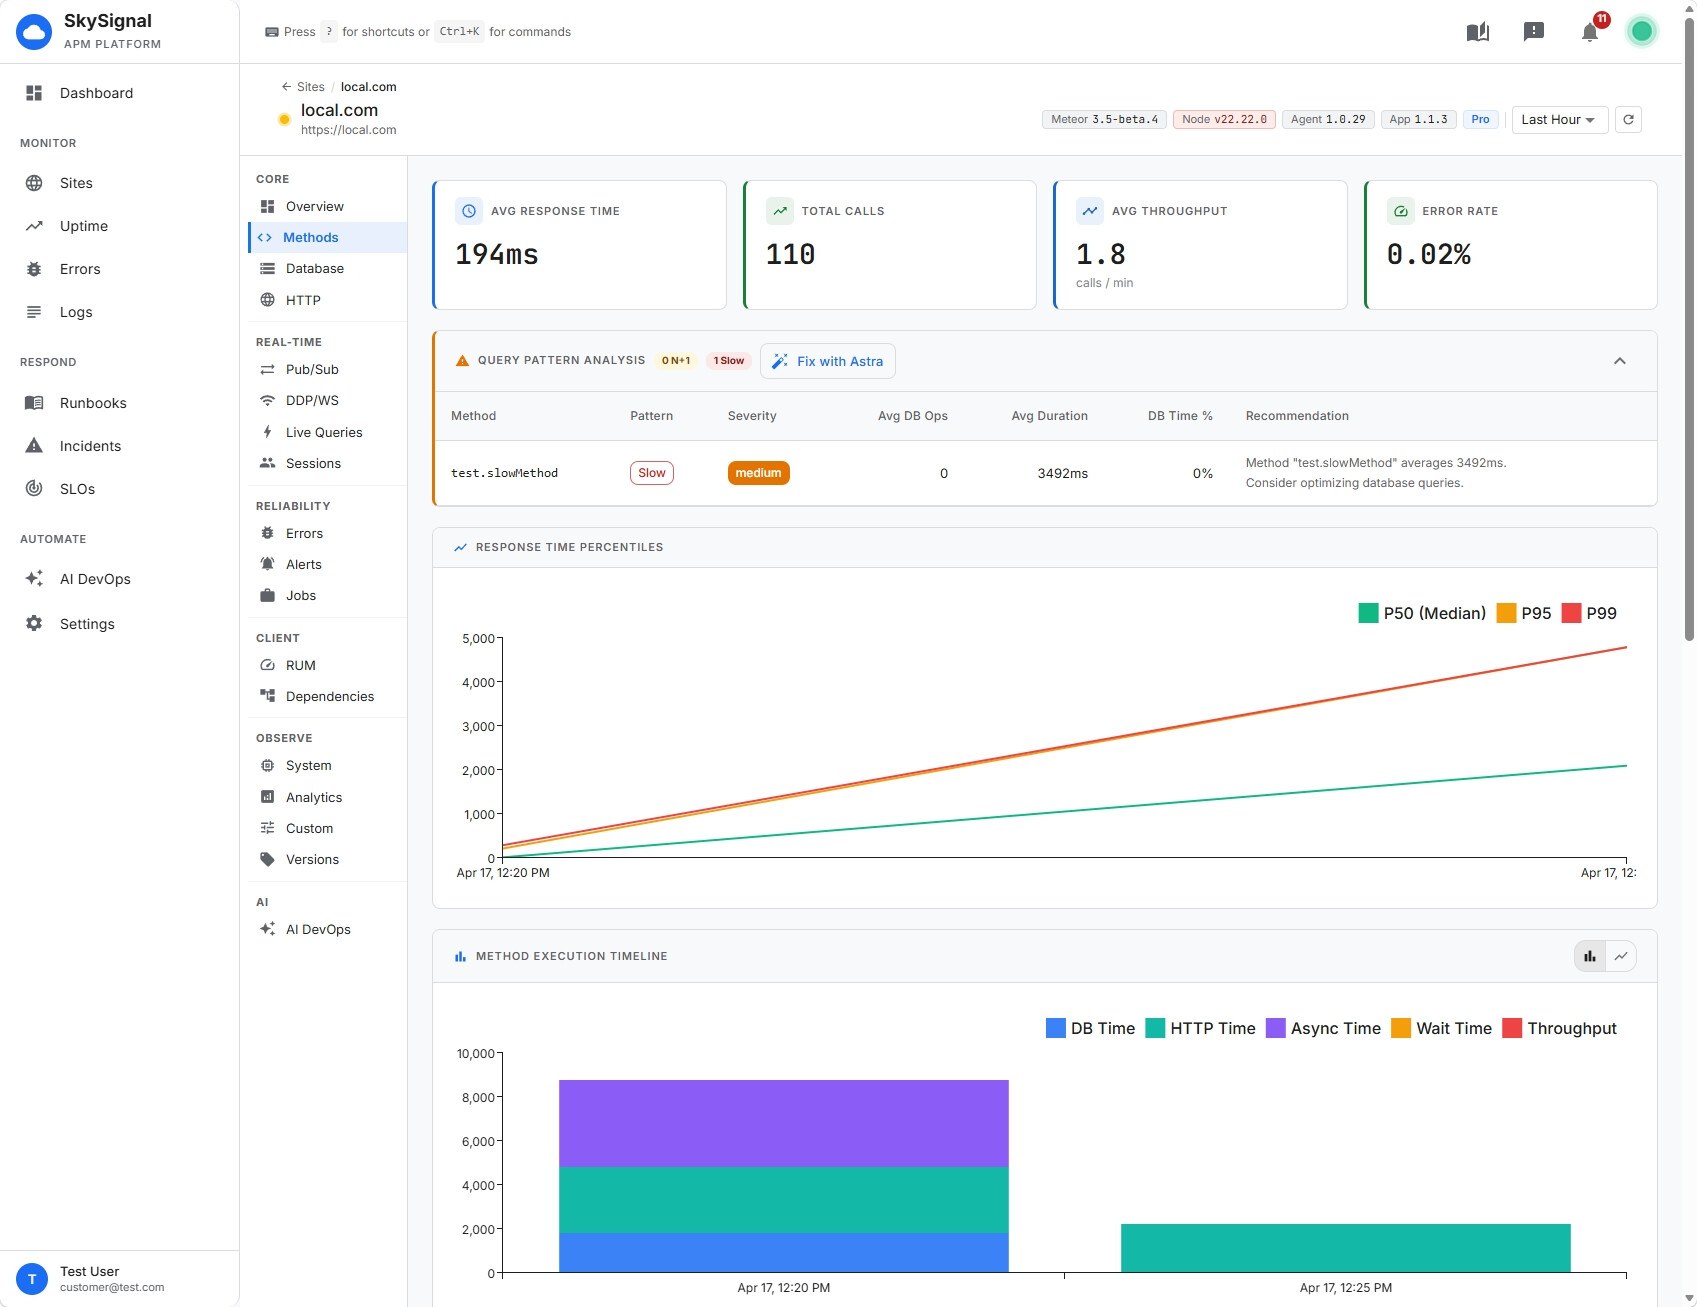
A richer System tab. It’s now 10 sub-tabs covering Resource Usage, Network & Load, Memory, GC, Runtime Internals (v8 heap, event-loop utilization, process resource usage), External Dependencies (DNS + outbound HTTP), CPU Profiles (on-demand inspector-based profiling), Hosts, Code Health (deprecated API usage, publication efficiency), and Security (npm audit + environment drift).
Smarter observer leak detection. The old binary 75%/95% thresholds are gone. Leak detection now uses a 7-signal confidence score (lifespan, updates/min, doc count, collection write frequency, DDP liveness, publication context, growth) and groups leaks by collection + pattern so you’re not drowning in per-observer rows.
Three-way live-query driver detection. Since Meteor 3.5, observers can run on change streams, oplog, or polling. The Live Queries view now shows which driver each observer is using, and the old “oplog efficiency” metric is replaced by a “reactive efficiency” score that correctly counts change streams as reactive.
Deeper agent instrumentation. DNS timing via dns.lookup/dns.resolve wrappers, outbound HTTP via diagnostics_channel (undici + http), on-demand CPU profiling when CPU spikes past a threshold, deprecated API tracking (sync vs async Meteor collection + method calls), publication over-fetch detection, environment snapshots (package versions, node flags, OS), and hourly npm audit scans.
Analytics tab improvements. A custom 12-color palette, a real legend, CSV export, and secondary-dimension breakdowns on line charts — so you can actually answer questions like “show me p95 method duration by host over the last 24 hours.”
If you’re running a Meteor app in production today, the honest pitch is this:
It’s built for Meteor. Methods, publications, DDP, live queries, MongoDB observers — these aren’t generic APM primitives with a Meteor adapter bolted on. They’re first-class. The agent understands what Meteor.publish is doing differently from a plain HTTP handler, and the dashboard reflects that.
The agent is one package. meteor add skysignal:agent, drop your API key in settings, restart. You get methods, errors, queries, publications, live queries, DDP connections, system metrics, DNS, outbound HTTP, vulnerability scanning, and deprecated API detection — from a single install.
Astra turns observability into action. Every other APM tells you where the bug is. Astra reads the same data and opens the PR. You get something no other APM offers: a pipeline that ends at “merge this PR” instead of “here’s a stack trace.”
There’s a real free tier. If you want to kick the tires, you can start free — 1 app, 24-hour retention, basic method tracing, error tracking. No credit card. Upgrade when it’s earning its keep.
Dashboard: dash.skysignal.app
Docs: docs.skysignal.app
Astra getting-started guide: docs.skysignal.app/docs/astra/getting-started
SkySignal Homepage: skysignal.app
Add the agent to your Meteor app, connect your GitHub repo in the AI DevOps tab, and fire your first Astra job manually from the Errors tab. Watch a PR open against your repo. Review it like any other PR.
Happy to answer any questions in this thread.