Introducing SkySignal: Modern APM Built for Meteor 3.0

I’m excited to announce SkySignal, a next-generation Application Performance Monitoring platform built specifically for Meteor 3.0 applications.

Why I Built SkySignal

Like many of you, I’ve been thrilled to see the revitalization of Meteor over the past few years. The Meteor Core team has done incredible work modernizing the framework - Meteor 3.0 with its async/await patterns, modern Node.js support, and improved performance has made the development experience better than ever.

But when it came time to deploy applications to production, I hit a wall.

The existing APM solutions for Meteor haven’t seen meaningful updates in years. They were built for a different era—before async/await, before modern Node versions, before Meteor 3.0. Trying to monitor a modern Meteor application with legacy tooling felt like driving a new car with a broken dashboard.

SkySignal is my answer to that problem.

What SkySignal Offers

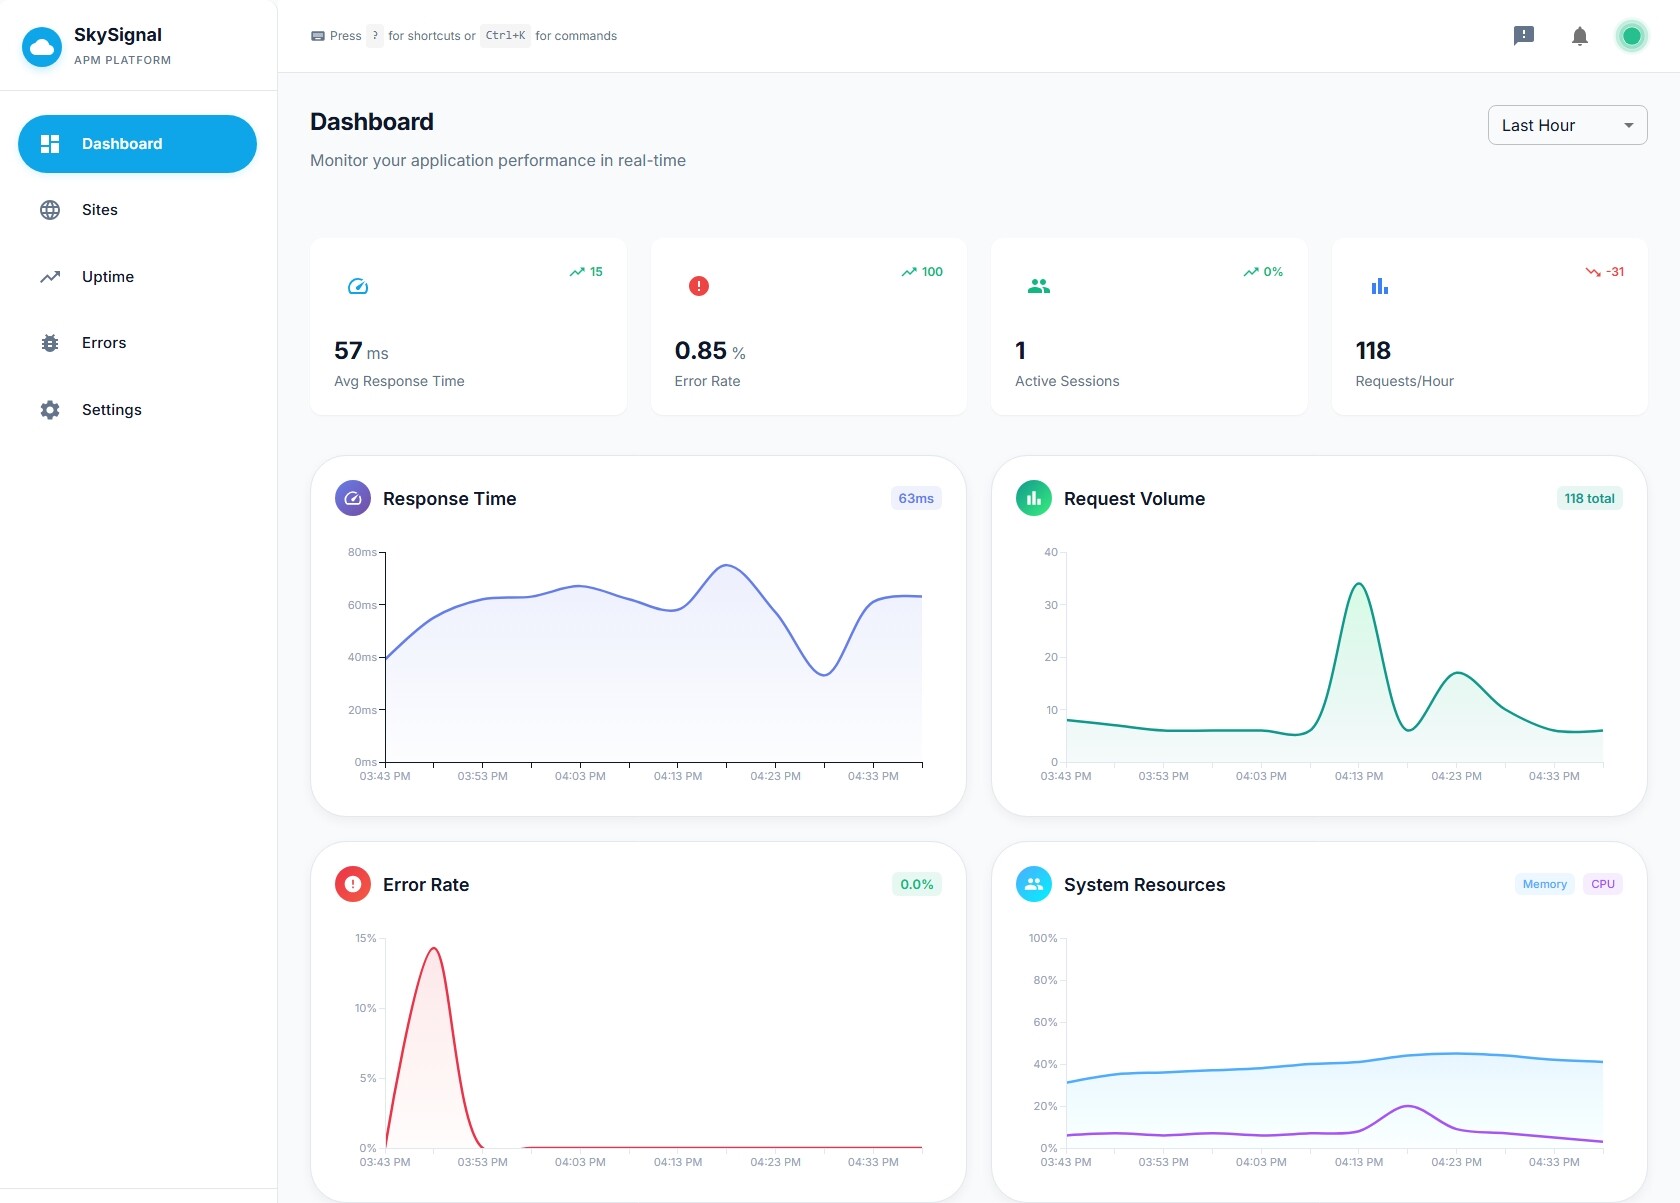
SkySignal is purpose-built for Meteor 3.0 applications with full support for:

  • Method & Publication Tracing - Track performance of your Meteor Methods and Publications with detailed timing breakdowns

  • Real User Monitoring (RUM) - Understand how your users actually experience your application

  • Error Tracking - Capture and aggregate errors from both client and server with full stack traces

  • Database Performance - Monitor MongoDB query performance, slow queries, and index usage

  • Live Query Monitoring - Track the performance impact of your reactive data subscriptions

  • DDP/WebSocket Connections - Monitor real-time connection health and message throughput

  • Background Job Monitoring - Track jobs from popular packages like msavin:sjobs (more coming soon, I started with sjobs since I use it myself.)

  • System Metrics - CPU, memory, event loop delay, and more

  • HTTP Request Tracking - Monitor outbound API calls and webhook performance

  • Custom Metrics - Track any application-specific metrics you need (WIP)

Built for the Modern Meteor Stack

SkySignal embraces the modern Meteor ecosystem:

  • Full Meteor 3.0 and async/await support

  • Compatible with modern Node.js 20+ runtimes

  • Designed for multi-host deployments with per-host filtering

  • Modern React-based dashboard with Material-UI
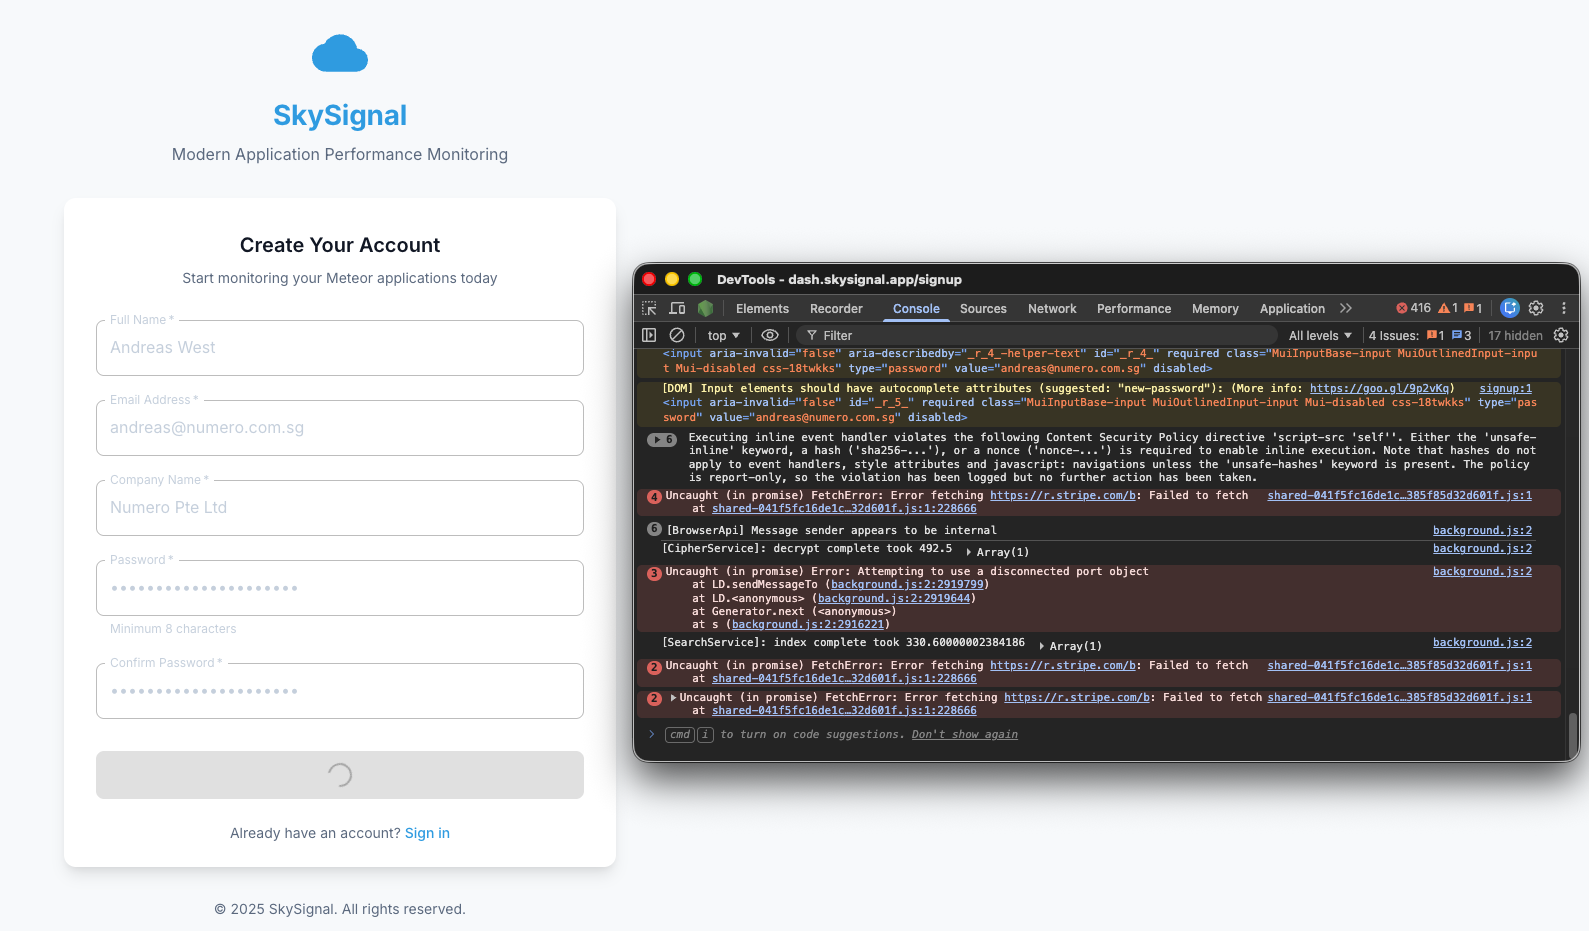
Easy Integration

Getting started takes just a few minutes:


meteor add skysignal:agent


// settings.json

{
   "skysignal": {
      "apiKey": "your-api-key",
   },
   "public": {
      "skysignal": {
         "publicKey": "your-public-key"
      }
   }
}

That’s it. The agent automatically instruments your Methods, Publications, and database queries with zero code changes required.

Current Status

SkySignal is currently in early access beta. The core monitoring features are fully functional, with new features being added regularly.

I’m actively looking for feedback from the Meteor community to help shape the roadmap and ensure SkySignal meets the real-world needs of Meteor developers.

Get Early Access

If you’re running Meteor 3.0 in production and want modern observability tooling, I’d love to have you try SkySignal and provide input of the beta version (there is a forever free tier available now).

Website: https://skysignal.app

Looking Forward

The Meteor renaissance is real. Between Meteor 3.0, the active core team, and the passionate community, Meteor is positioned for a strong future. I believe SkySignal can be part of that story – providing the production observability that modern Meteor applications deserve.

I’m building this for the community, and I want your input. What monitoring features matter most to you? What pain points do you have with your current setup?

12 Likes

Very interesting project, I’m quite curious is the agent code based on the old Kadira stuff or entirely brand new? What does SkySignal offer that Monti APM can’t?

3 Likes

It’s entirely brand new - written from scratch for Meteor 3.x. No Kadira lineage. The agent uses modern async/await patterns, modular collectors, and a fire-and-forget HTTP transport with batching. You can check out the architecture yourself since it’s designed to be lightweight and non-blocking.

What SkySignal offers differently (more to come):

  • Built for Meteor 3.x - Native async/await support, no Fibers dependencies
  • MongoDB connection pool metrics - See pool utilization, available connections, and connection wait times
  • Collection statistics - Document counts, index sizes, and storage metrics per collection
  • Performance budgets - Set thresholds for methods and get alerted when they regress
  • Weekly/Monthly Reports - Receive scheduled reports summarizing application KPIs
  • Enhanced Method Analytics - Provides insights and optimization suggestions based on database query structures (i.e., N+1 queries). Support for logging Mongo Aggregations, as opposed to Monti’s “async” catch all for aggregations.
  • Uptime Monitoring - Uptime monitoring and alerting included - trying to emulate Meteor’s “batteries included” design philosophy.
  • RUM (Real-time User Monitoring)
    – User Action Tracking
    – Page Load Performance - LCP, FID, CLS, TTFB
    – Performance by Page
    – Browser Distribution Tracking
    – Geographic Performance Tracking
    – User Device Insights
  • Session Tracking
    – Active Users
    – DAU / MAU
    – Session Duration Tracking
    – Bounce Rate

You can check out more here: Getting Started | SkySignal Docs

2 Likes

Looks cool but honestly - would love to see this as an open source project with a paid license.

Store all the data in your MongoDB or set up a dedicated DB instance with remote connection.

The UI can be pulled up via dynamic import right in app too.

I feel like most of the heavy work is in the open source agent library anyway, and that part is being given away for free.

Regardless, looks very good - and like something I would use!

Thank you for the feedback @msavin! (Really appreciate your Steve Jobs package, I use it in several of my applications)

As for your suggestion on building an open-source package that allowed developers to embed the metric dashboards / management interfaces within their apps – I thought about doing this as well.

However, I came to the conclusion a standalone service to consolidate tools I use to monitor my production apps needed it’s own environment. Tools such as performance reporting, user analytics, up-time monitoring – made more sense to have in a centralized dashboard for managing multiple apps.

In the future I want to integrate AI agents which monitor application logs for errors and performance issues, then automatically submit PRs to projects with bug fixes or performance improvements all based on the metrics logged in SkySignal. It will essentially be DevOps on autopilot.

2 Likes

I’m really glad to see that you took the initiative and even went through the trouble of drafting a completely new agent. :clap: :clap:

Hey missed that part in your initial message but that’s great to hear - thanks!

I agree but lots of apps I worked on also have data protection requirements and that gets complicated quickly.

Damn that sounds like a really good idea.


I think the key is like, how big of a market is there for Meteor? If you get a few thousand apps to pay than this can be great lifestyle business. If not, you might hate having to maintain and scale it as some point.

With Meteor Candy, I didn’t have any of those issues and just charged companies ~$100/year on auto-renew, and that made the whole thing effortless. And I was able to dodge data security questions, uptime requirements, scaling/performance, etc.

But either way, looks really great, very much looking forward to using this!

It would be incredible to offer an on-prem version for self hosted environments with strict data residency requirements. I have been building something similar and was planning on open sourcing it in the coming months. I would love to stop working on my solution and use something more feature rich and maintained, but also can be ran on-prem.

Exciting project and wish you the best success!

3 Likes

First of all, great that you started this project, fresh blood and some new ideas are always good.

You’ve asked for feedback, here we go:

  • I love the landing page, look & feel is great and it’s fast
  • Sign-up was a bit different. On my first try it didn’t load at all, even after 30 seconds. Closed it and tried again. Still much slower (I know, you have to start Meteor).
  • It throws error in DevTools:

Uncaught (in promise) FetchError: Error fetching https://r.stripe.com/b: Failed to fetch
at shared-041f5fc16de1c1760a385f85d32d601f.js:1:228666

Uncaught (in promise) Error: Attempting to use a disconnected port object
at LD.sendMessageTo (background.js:2:2919799)
at LD. (background.js:2:2919644)
at Generator.next ()
at s (background.js:2:2916221)

Uncaught (in promise) FetchError: Error fetching https://r.stripe.com/b: Failed to fetch
at shared-041f5fc16de1c1760a385f85d32d601f.js:1:228666Understand this error
2shared-041f5fc16de1c1760a385f85d32d601f.js:1 Uncaught (in promise) FetchError: Error fetching https://r.stripe.com/b: Failed to fetch
at shared-041f5fc16de1c1760a385f85d32d601f.js:1:228666

The signup doesn’t work for me. I know it’s Beta and I hope you can fix it.

Let me know when I should try it again.

1 Like

More errors from Dev Tools:

The jquery npm package could not be found in your node_modules directory.
Please run the following command to install it:

meteor npm install jquery

If you previously relied on a specific version of jquery, it may be important
to install that version; for example:

meteor npm install jquery@1.12.1

main.js @ e6e365589511c1b7c014fcf27efa428fec22e65f.js?meteor_js_resource=true:348Understand this warning
6Executing inline event handler violates the following Content Security Policy directive ‘script-src ‘self’’. Either the ‘unsafe-inline’ keyword, a hash (‘sha256-…’), or a nonce (‘nonce-…’) is required to enable inline execution. Note that hashes do not apply to event handlers, style attributes and javascript: navigations unless the ‘unsafe-hashes’ keyword is present. The policy is report-only, so the violation has been logged but no further action has been taken.
2shared-dee34aba733a06e58a94698c0844992a.js:1 Uncaught (in promise) FetchError: Error fetching https://r.stripe.com/b: Failed to fetch
at shared-dee34aba733a06e58a94698c0844992a.js:1:229187

This is when trying to add a new site via this route: SkySignal - Modern APM for Meteor.js

Not sure if I’m the only one who is having so many problems. I’ve finally been able to onboard but setting things up is painful with the website not responding or being so painfully slow to respond (it takes minutes for the “Saving” to go away).

We are working on migration of services to alleviate load time issues. We should have the final production environment live in the next week.

Update:

We’ve migrated our MongoDB hosting - performance improved drastically.

It appears this error could be from an ad-block extension. Could you try disabling this?

1 Like

Yes, when I turn Adaware adBlock off the error vanishes. Still should be handled better by the app but I guess this is very low priority right now.

It feels a lot faster but the login page is still to slow. MongoDb needs memory, a lot of memory, guess your found that out.

Not sure where you’re planning to host but I can recommend Quave, especially as they are happy to help Startups like yours (and mine) to fix such problems. Try that with AWS and all your will hear is buy our $xxxx support.

Last comment, your instructions for the public and private key are a bit misleading IMO (put them into a settings.json file). This app will be used for Production apps only (at least for me), so there’s a high chance you need to add your keys into some sort of UI at the cloud provider.

I also have to comment that MontiAPM was a much smoother experience in that regard. Just an observation from someone who is using both apps.

On the positive side, the password reset workflow was fast and excellent, one of the best I’ve seen. Seems you put a lot of time into it.

I also like the 5 steps to get going and how you setup the UI/UX. Again, it seems you put a lot of time and thinking into this.

So it looks that the app needs some polishing, which you’re already working on. Haven’t connected it yet to my Production app but will give more feedback once it’s done.

Keep it up!

2 Likes

Extremely grateful for the thorough feedback you are providing. We are continuing to polish and optimize the application every day to get it to a stable release.

Our onboarding experience will become on-par with MontiAPM once we finish polishing the user setup guide.


Excited to hear your feedback on the monitoring UI and overall analytics once you test an app connection.

2 Likes

Happy to help, been there myself.

Here’s one point in the onboarding which feels a bit broken. You’re asking to add the siteId but there’s no instructions where it can be easily found. I just spent 5 minutes on your app and I can’t find it. I assume it’s in the URL when I click on “Details” but not that this will show the user’s 5 step onboarding instructions and not a detailed modal.

Also, resetting the API keys is hidden too much in the “settings” of another sub-menu, it’s not visible to the user. Just found it by accident but it should be more prominent.

Lastly, wouldn’t it be safer to just refer to the keys like this:

import { SkySignalAgent } from '@skysignal/agent';

SkySignalAgent.init({
    apiKey: Meteor.settings.skySignal.apiKey,
    siteId: Meteor.settings.skySignal.siteId,
});

People will follow instructions and just copy & paste, then unknowingly publish API keys on Git.

Lastly, should be:

meteor npm install --save @skysignal/agent

Getting the following error still:

npm notice Access token expired or revoked. Please try logging in again.
npm error code E404
npm error 404 Not Found - GET https://registry.npmjs.org/@skysignal%2fagent - Not found
npm error 404
npm error 404  '@skysignal/agent@*' is not in this registry.
npm error 404
npm error 404 Note that you can also install from a
npm error 404 tarball, folder, http url, or git url.
1 Like

We will update the app’s onboarding instructions - the documentation instructions are more up-to-date: Getting Started | SkySignal Docs

1 Like

No problem, Michael. I’ve checked the link and have a question:

Add your keys to your Meteor settings file. Create or update `settings.json

Does that mean that the keys are kept in two files? It’s not clear to me and if so, why is that so. Keeping them in one file should be enough, or not?

As mentioned I’ve ran into problems and as I’m working on that repo right now, have commented out SkySignal for now as the app otherwise doesn’t run.

This looks pretty awesome​:+1::+1::+1:. I’m currently using MontiAPM, but I’d be happy to upgrade to a modern APM built for Meteor 3.0. However, it seems SkySignal is still in beta at the moment? Once I have some time, I’ll carefully evaluate whether it’s worth migrating from MontiAPM to SkySignal. Also, a quick bit of feedback: I entered a random company name, and it doesn’t seem to be editable.

3 Likes

SkySignal February Update - A LOT of new stuff

Hey everyone,

It’s been a really productive month so I wanted to share everything that’s been going on with SkySignal. This is a big one, so grab a coffee.

Dashboard got a major visual upgrade

The main customer dashboard now has 4 new data visualizations that go way beyond the standard line charts:

  • Heartbeat Timeline - Think of it like an EKG monitor for your app. It’s a continuously scrolling line that shows your response latency in real-time, color-coded green/amber/red based on thresholds. There’s a pulsing dot at the leading edge that gives you an instant sense of whether things are healthy. It’s a small thing but it makes the dashboard feel alive.

  • Request Flow Sankey - This one is really useful. It’s a Sankey diagram that shows how requests flow through your Meteor Methods and into downstream operations (database queries, HTTP calls, async work, etc). You can see at a glance which methods are getting the most traffic and what they’re actually doing under the hood. Hover over any link and you get call counts and average durations. Methods with errors get flagged in red.

  • Site Health Heatmap - If you’re running multiple sites, this gives you a GitHub-contribution-style grid where rows are your sites and columns are time buckets. Each cell is color-coded by a health score derived from error rate and response time. It’s great for spotting patterns - you can immediately see if a specific site had a bad hour or if something degraded across all sites at once.

  • Anomaly Constellation - A radar chart that overlays your current metrics (response time, error rate, CPU, memory, requests/hour, sessions) against rolling 7-day baselines. When something deviates significantly, that vertex gets a pulsing red indicator. The center tells you how many anomalies are active, or just says “Normal” when everything’s fine.

All four are fully custom SVG (not a charting library), so they look and feel exactly how we wanted them to. They’re responsive too - they adapt cleanly to mobile and tablet.

New pages: Incidents, SLOs, Runbooks, and Logs

We shipped four entirely new sections:

  • Incidents (/app/incidents) - Full incident management lifecycle. Create incidents, assign severity (sev1-4), track through investigating > identified > monitoring > resolved > postmortem. Each incident has a timeline of events, can link to related errors and alerts, and supports structured postmortems with action items.

  • SLOs (/app/slos) - Define Service Level Objectives for availability, latency, error rate, or throughput. Set your target, pick a rolling window (7d to 90d), and SkySignal tracks your error budget in real-time. You get burn rate calculations and alerting when you’re consuming budget too fast. This was a highly requested feature and it’s something we think every team monitoring a production Meteor app should be using.

  • Runbooks (/app/runbooks) - Operational runbooks for your team. Document step-by-step procedures for incident response, performance debugging, deployment checklists, etc. Each runbook has ordered steps with descriptions, commands, and expected outcomes. They can be triggered manually or configured to fire on alerts and error patterns.

  • Logs (/app/logs) - Structured log aggregation. The agent now captures console.* and Meteor Log.* output from your app automatically. Logs are correlated with traces, errors, and sessions, so you can jump from an error to the logs surrounding it. Full-text search, level filtering, and a 30-day retention window (Pro plan).

Site Detail improvements

A bunch of new capabilities in the site detail view:

  • Trace Waterfall - Click into any method trace and you get a full waterfall diagram showing every operation (DB queries, HTTP calls, async work) on a timeline. It automatically flags N+1 query patterns, slow queries, and unblock analysis. Think Chrome DevTools network waterfall but for your Meteor Methods.

  • Session Timeline - Click into a user session and get a visual timeline of their journey: page flow, events, performance metrics per page, and error correlation. Really useful for debugging user-reported issues.

  • DDP Inspector - A real-time activity feed showing DDP events (subscribes, ready signals, data mutations, errors) for a site. Includes a connection detail dialog and subscription inspector.

  • Versions Tab - Side-by-side version comparison. Select two deployed versions and see deltas for all your key metrics, color-coded green for improvements and red for regressions.

  • Deploy Markers - Deployments are now detected automatically (via GitHub webhooks or agent version change detection) and shown as vertical markers on your time-series charts. Each deployment gets an automatic canary analysis that compares the 15-minute window before and after the deploy, checking latency, error rate, throughput, and new error count. You’ll get a pass/warning/fail verdict.

Change Streams support (Meteor 3.5-beta+)

This is a big one for anyone testing Meteor 3.5-beta+. The agent’s LiveQueries collector now detects the actual observe driver per observer - Change Stream, Oplog, or Polling - by introspecting handle._multiplexer._observeDriver.constructor.name. Previously it used a global MONGO_OPLOG_URL heuristic which treated everything as either oplog or polling.

The “oplog efficiency” metric has been replaced with “reactive efficiency” which is (changeStream + oplog) / total observers. The LiveQueries tab in the SkySignal dashboard reflects this 3-way breakdown.

Anomaly Detection & Observer Leak Detection

Two new background services running automatically:

  • Anomaly Detection - Computes rolling 7-day statistical baselines (mean, stdDev, p95) for your metrics and raises anomaly events when values deviate beyond configurable z-score thresholds. Includes hourly and daily seasonality patterns.

  • Observer Leak Detection - Four heuristic patterns that detect Meteor reactive observer leaks: growing observer counts per collection, long-lived stale observers (>24h with low update rates), inactive observers (zero activity for 30+ minutes), and orphaned observers (outlived their subscription). Integrates with alerts.

Agent improvements (v1.0.12)

  • Log Collection - New LogsCollector that wraps console.* and Meteor Log.* with structured metadata, level filtering, and sampling. You can also use SkySignalAgent.addLog() for programmatic submission.
  • Custom Metrics API - SkySignalAgent.counter(), .timer(), .gauge() for tracking business-specific KPIs. Also a generic trackMetric() for full control.
  • Client-side error tracking fix - Fixed a bug where the server returned 400 “Invalid JSON” when the agent sent batched client errors. The endpoint was trying to read the raw request stream after body-parser had already consumed it. Also added support for the batched { errors: […] } format the agent actually sends.
  • Silent failure for optional packages - If your app doesn’t have the http or email Meteor packages installed, the agent no longer logs warnings to the console on startup. This was confusing for a lot of people.
  • Client IP collection - Method traces now include the client’s IP address for geographic correlation.
  • HTTP Collector performance - Pre-compiled regex patterns, object pooling (50-object pool for request data), and combined exclude patterns for O(1) matching.

Mobile responsiveness

Went through the entire app and compacted metric cards to 2-per-row on mobile (they were full-width before, which meant a lot of scrolling). This applies to the dashboard, overview tab, and all 15+ site detail tabs.

Coming Soon

A few things are built and ready but not publicly enabled yet:

  • Astraeus AI DevOps - Our autonomous AI agent that analyzes errors, fetches your source code from GitHub, generates a fix using Claude, and creates a pull request. The full pipeline is built: a Docker-based worker container that clones repos, creates worktrees, runs Claude Code, and pushes PRs. It supports auto-analysis triggers, post-deploy watch mode, human approval workflows, and rate limiting (20 analyses/day). The UI is complete with a job dashboard, real-time streaming output, and settings panel. We’re doing final testing before enabling this.

  • Integrations - GitHub, Slack, Discord, PagerDuty, email, and custom webhook notification channels are built in the settings view but not yet exposed.

  • Custom Dashboards - Drag-and-drop dashboard builder with configurable widgets (metric cards, charts, data tables, SLO status, error lists, etc). This is built and working but we’re polishing it before release.

  • Infrastructure Upgrades - As SkySignal is close to being ready for production-use, we are in the process of optimizing our hosting infrastructure.


That’s it for now. It’s been a huge month of shipping. If you’re running the agent, update to v1.0.12 for the latest fixes and features. As always, bug reports and feedback go to GitHub · Where software is built.


If you have not tried SkySignal yet – get started in five easy steps:

  1. Sign Up for a free plan at Sign Up - SkySignal APM
  2. Create a new site on the “Sites” page
  3. In your Meteor settings.json file add:
  "skysignal": {
    "apiKey": "YOUR_SECRET_KEY_GENERATED_FROM_SITE_CREATION",
    "enabled": true
  },
  "public": {
    "skysignal": {
      "publicKey": "YOUR_PUBLIC_KEY_GENERATED_FROM_SITE_CREATION",
      "rum": {
        "enabled": true,
        "sampleRate": 1.0
      },
      "errorTracking": {
        "enabled": true,
        "captureUnhandledRejections": true
      }
    }
  }
  1. Run meteor add skysignal:agent
  2. Start using your app and watch metrics populate in your account within a few seconds
6 Likes