I recently moved my app deployment from an aws ec2 box to scalingo, which is really awesome (this is a non-paid ad ;)). I started with containers with 512mb RAM, since due to my monti apm my hosts typically run at around 320mb while under medium to heavy load.
Now, during higher load, containers start to crash due to memory allocation failures like this:
59515 ms: Scavenge 250.6 (257.5) -> 249.7 (257.8) MB, 1.2 / 0.0 ms (average mu = 0.363, current mu = 0.366) allocation failure
I don’t really get why, containers don’t even use swap.
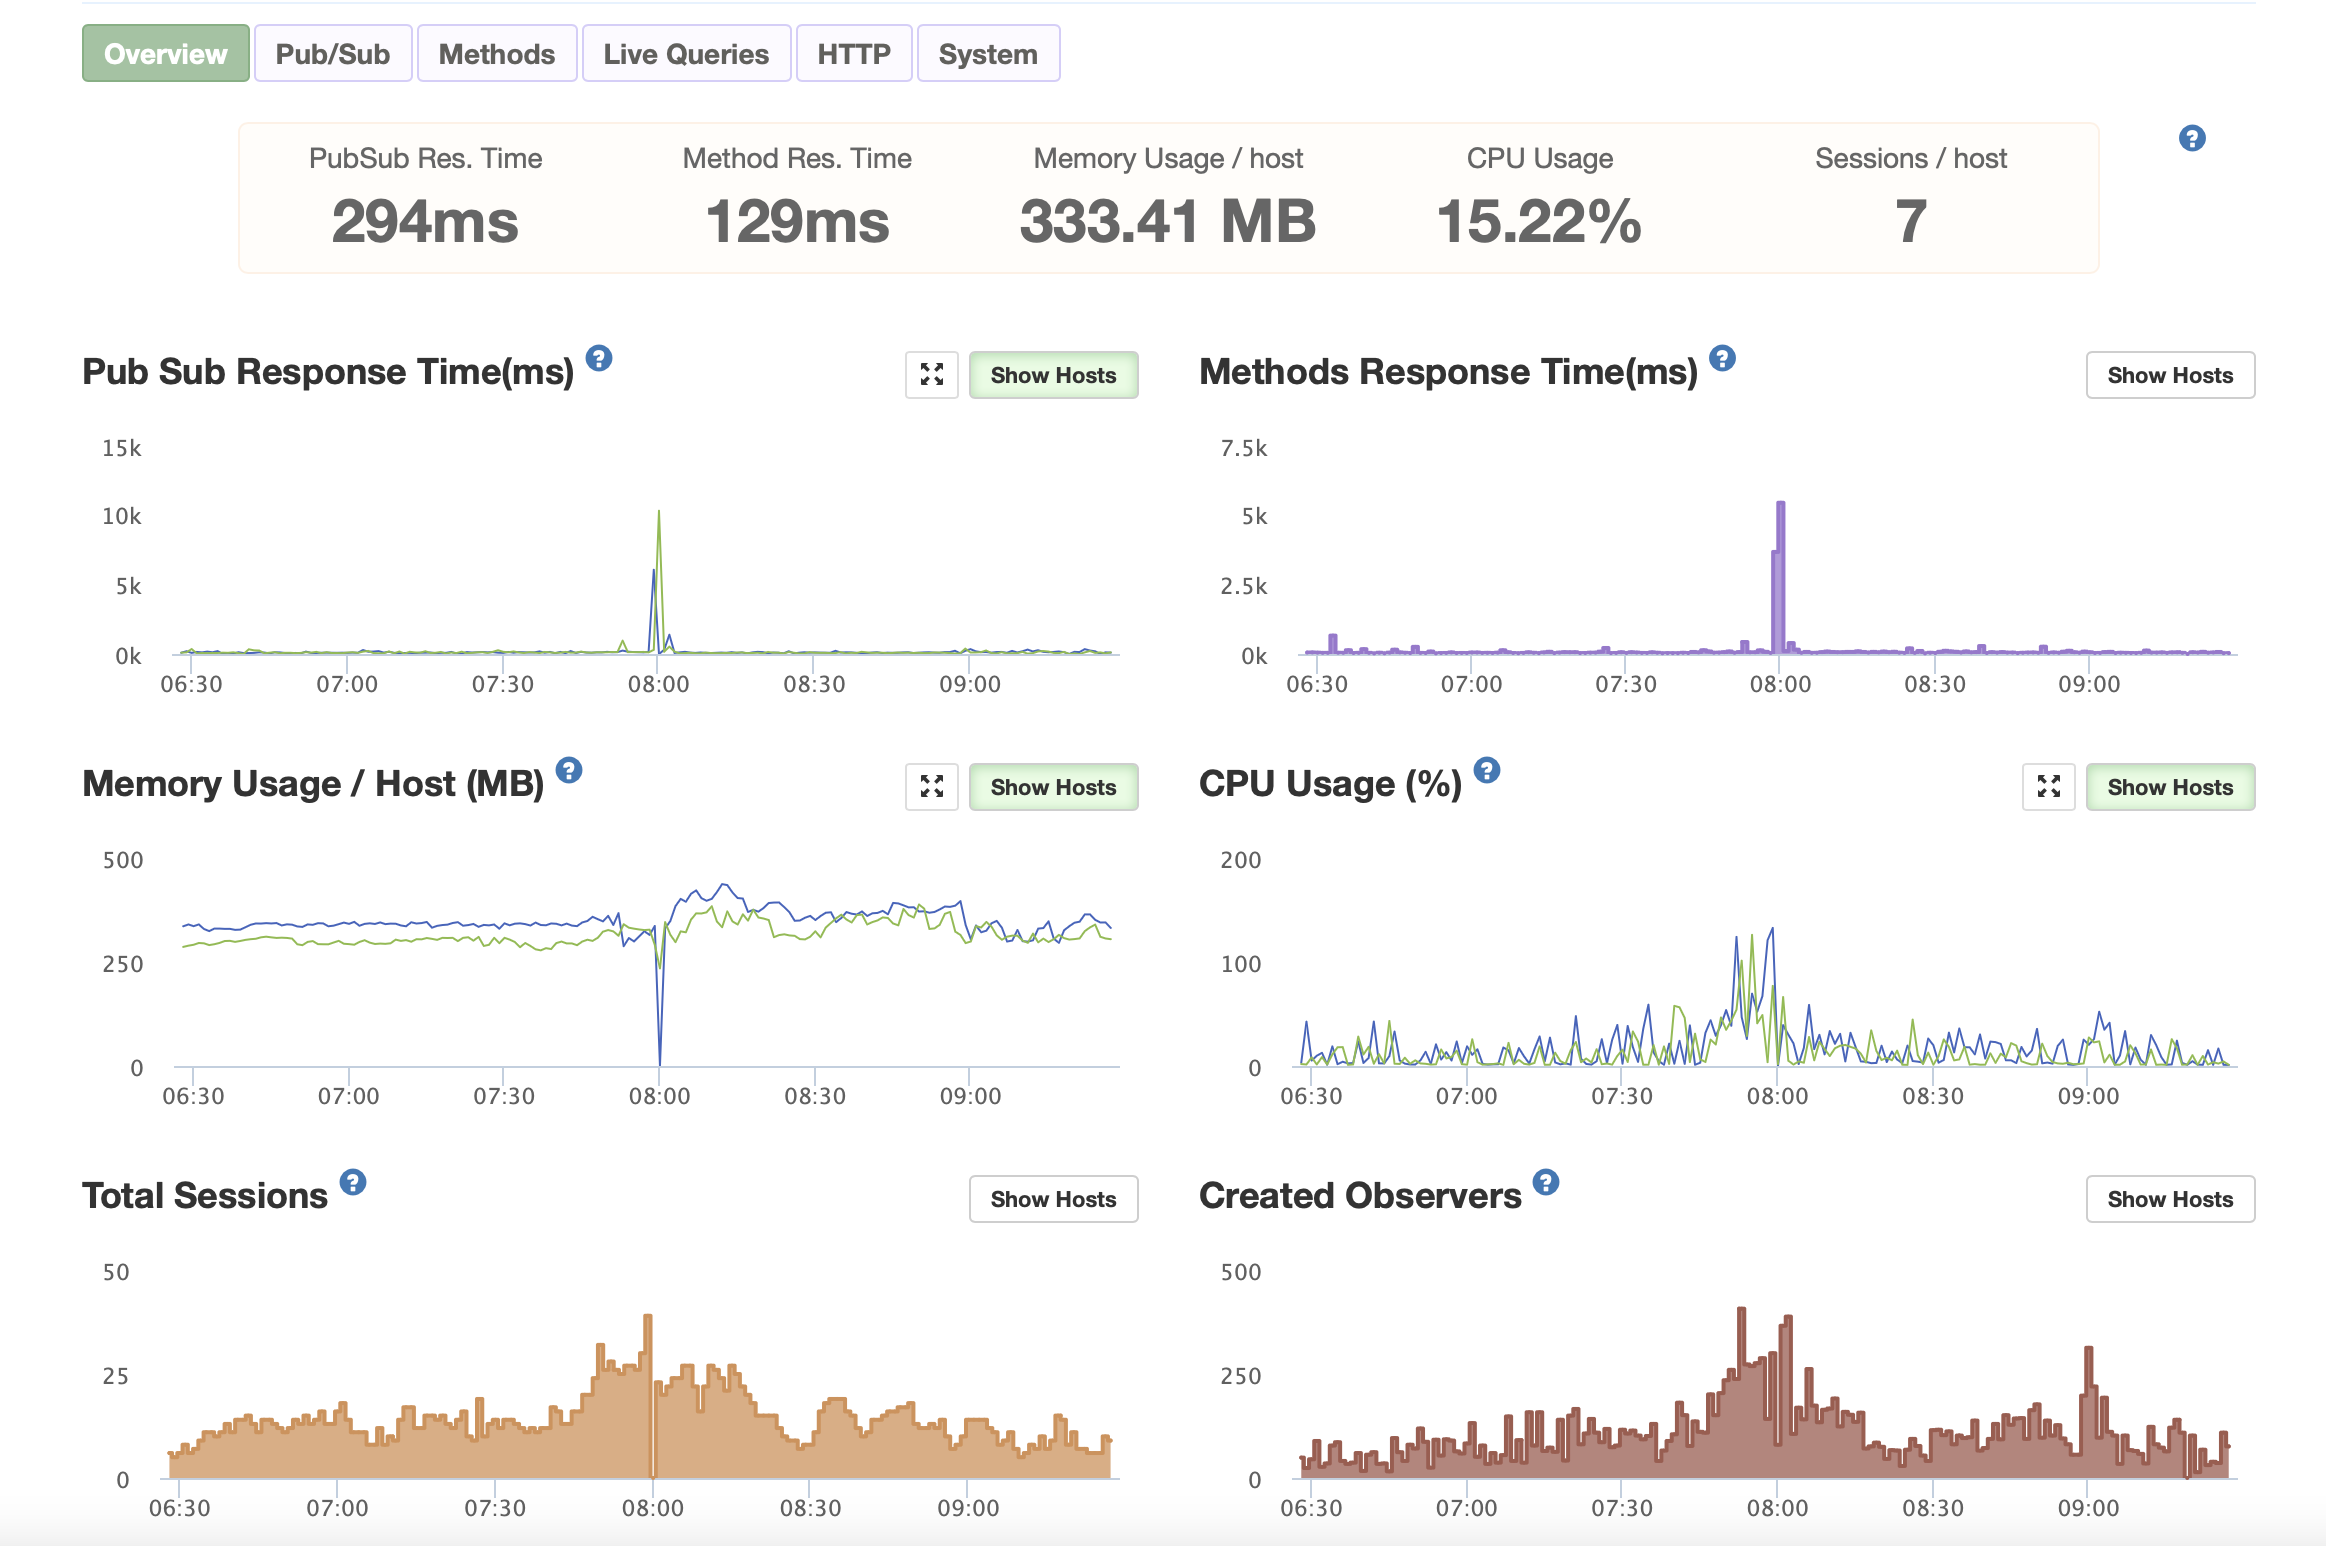
Both hosts were hitting 100% peak, but not continuously. Memory was at around 290mb / 330mb on respective hosts. The app is used for school organization purposes, so exactly at the beginning of a school day we have around 5000-7000 initially added observer changes per minute and several new sessions.