Memory increase over time till halt/slow

I made an application where i use

Test.find({Status:'waiting'}, sort: {Time:1}).observe 
    added: (document) ->
        Test.remove _id:document._id
            dosomething(document)

dosomething() matches the documents contents with other documents and calculates a math outcome.
The purpose of this is to do a server side reactive computation of documents inserted by the user.

There is no UI or direct connected users on this application.

I works pretty well and this is the only purpose of this application or “applet”

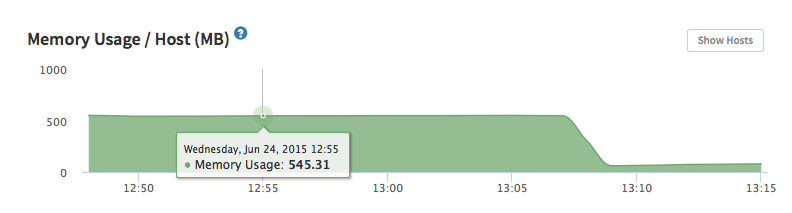
The only thing that bugs me is the more computation it does the more RAM it consumes over time and does not free it until it does not respond anymore.

Any ideas?

If i restart the app it goes back to normal. It runs on the AWS

You seem to add documents to the collection, but do you ever remove any? If not, the server-side merge box would grown and grow over time in terms of memory consumption, until of course it hits the limit.

kadira.io has a profiler tool, but I think that that currently does not capture memory usage, but only CPU. And I’m not specifically familiar with nodejs-based profiling tools, but I know that options exist, and so it should also be possible to look at exactly what’s happening at runtime.

Also, did you try and reproduce that behavior just on your local machine, just by adding a lot of documents in short succession? You should be able to see memory usage grow just as well.