Meteor 1.6 debugging with webstorm or IntelliJ

Just in case someone else finds this useful, we have meteor 1.6 debugging working nicely in WebStorm and IntelliJ.

Configuring:

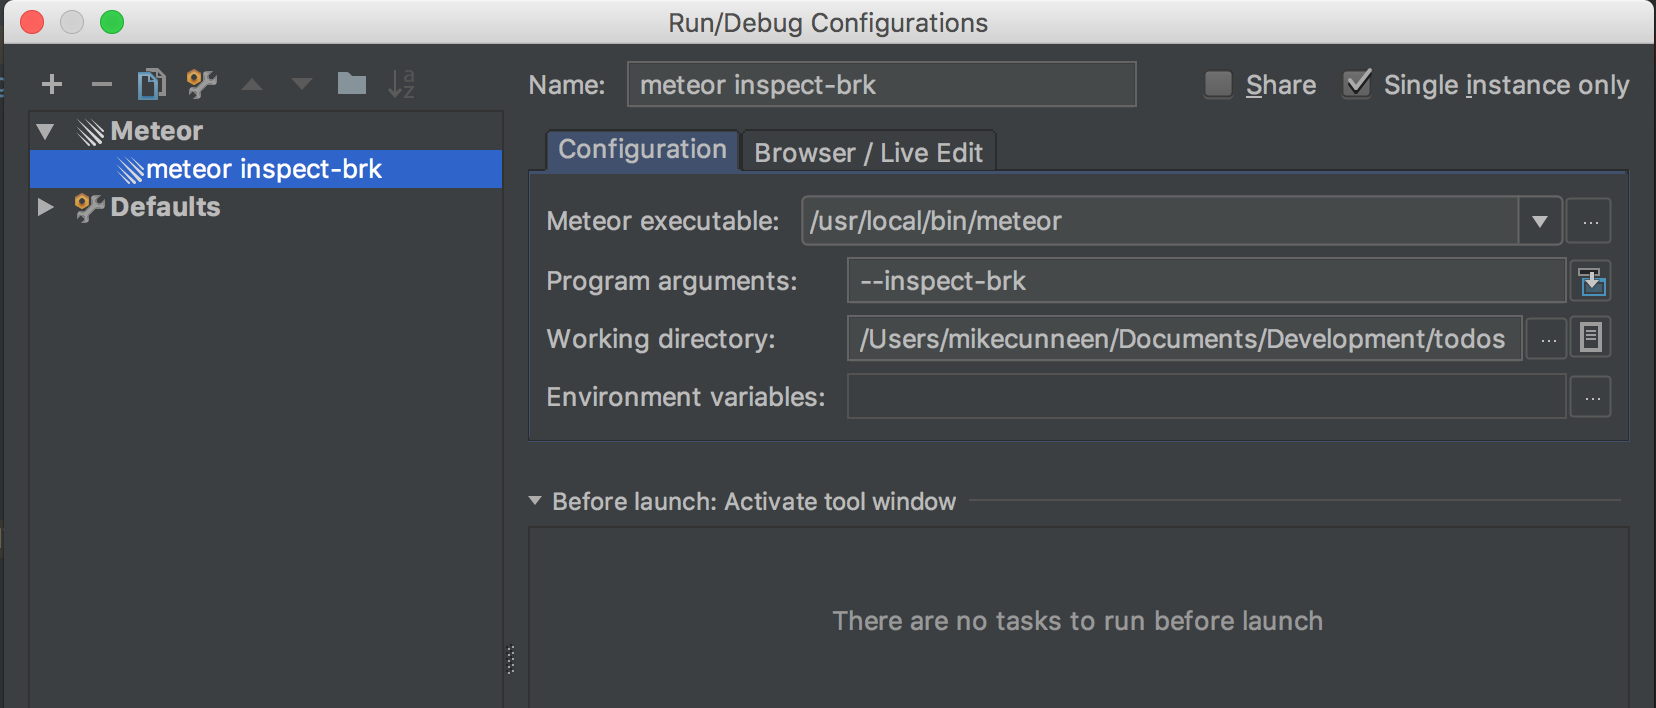
  1. Create a meteor run profile with the normal options for the project ( --settings etc), but add a --inspect-brk parameter.

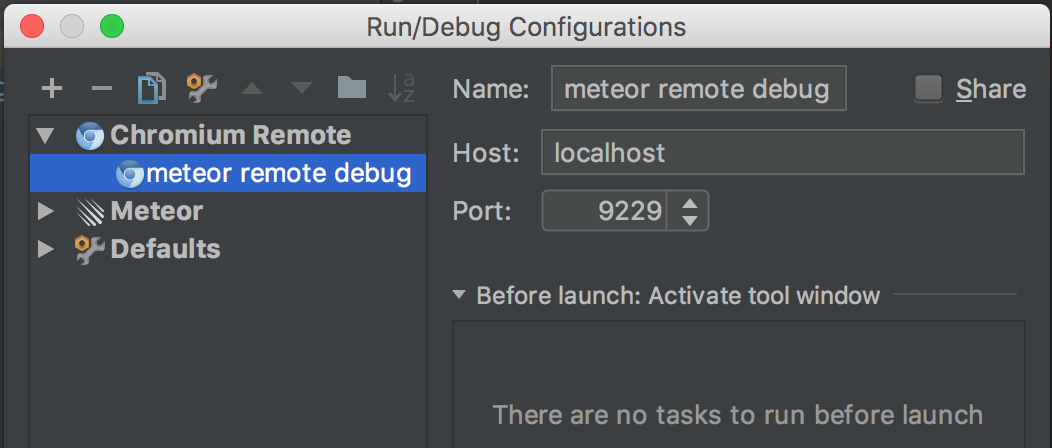
  2. Create a separate run “Chromium Remote Debug” profile. Change the port number to 9229 .

Running:

  1. Run the meteor run profile first (don’t choose debug; choose to run it).
  2. Debug the Chromium Remote Debug profile.
11 Likes

You can now use debug button since that will let you use the ide to debug things, as long as you pass --inspect (default being inspect-brk).

The remote chromium I suppose is attach to node/chrome, which doesn’t work for me even with installed extension, and help article isn’t helpful.

1 Like

I just use a normal meteor run profile, like the top image in the original post. I get server breakpoints in WebStorm and client breakpoints in Chrome.