Meteor APM, why is fetch so long?

Hello,

I am using Meteor with Galaxy for a very long time, I always add APM to have an overview of my app.
This is working great so far.

By looking into details, I have a find on a user and a fetch that is taking ages.

I have no idea what can cause such a long time on fetching a single user by id.

Do you guys have experienced such problem ? Do you have any idea why it is taking so long ?

Thanks,

Ps: I you are wondering why there is a fetch before every other operation on a collection, I am using a multitenancy package in my app

1 Like

It could be that you don’t have an index for the _groupId field in the collections that are working in multi-tenancy fashion, so those fetches will be slow.

If you are using simpleschema to define your user schema(or any toher collection that has de the _groupId), you could try this to add an index:

 _groupId: {
        index: 1,
        type: String
    },

Otherwise you will have to use something like

Meteor.users._ensureIndex({_groupId: 1});
1 Like

Thanks @tcastelli

I have already this index for all my collections, also the query is by _id which has an index on it by default. Or maybe I am wrong ?

What I do no get is the difference between find and fetch.
My guess is that it is not a database problem, because mLab tells me all the slow queries I have.

Here is the code of the publication :

Meteor.publish("validationsForStudent", function publish(
  studentId,
  skillId,
  blockId
) {
  check(studentId, String);
  check(skillId, String);
  check(blockId, String);
  this.unblock();
  if (!this.userId) {
    return this.ready();
  }
  return [
    Validations.find({ studentId, skillId, blockId }),
    Skills.find({ _id: skillId }),
    Blocks.find({ _id: blockId })
  ];
});

After pasting this, I had a tought that I do not need to run through multitenancy hook in this case, I could write

Meteor.publish("validationsForStudent", function publish(
  studentId,
  skillId,
  blockId
) {
  check(studentId, String);
  check(skillId, String);
  check(blockId, String);
  this.unblock();
  if (!this.userId) {
    return this.ready();
  }
  return [
    Validations.direct.find({ studentId, skillId, blockId }),
    Skills.direct.find({ _id: skillId }),
    Blocks.direct.find({ _id: blockId })
  ];
});

Because there is no ambiguity on the find, it is relevant only when I write

Collections.find({})

There is no link with my initial question but this might be of interest for some people.

But I still do not get why I am doing a fetch in a publication that is suppose to return a cursor.

Yes you are right I didn’t pay attention to that. Since the query is by id, and id has always an index, it should always be fast. Fetch time,however, is determined by the size of the document/s fetched and the connection with the database. Also I guess that if you have the field fetched from memory (with an index), it should be faster than fetching from disk.

Since both things are covered I’m not sure what is making your fetch slow(document size is small), so maybe it is related to connection issues at that moment in time.

Have you tried to fetch that document again manually and compared times to see if that time is always the same?

No time is not always the same, and I can tell that by looking at the image above : each time I find on a collection I first find and fetch on the users collection.
And times are different :

  • 1001 ms
  • 100 ms
  • 97 ms

That is very strange.

Any explanation ?

1 Like

Again here :

It spends 3291out of 3993ms just for fetching the same user several times

1 Like

If your server has high CPU usage then Kadira will report incorrect numbers on query response time. Kadira just measures the time from (db query start) -> (db response processed). If the CPU is high, then it might take a while for the db response to be properly processed, even if the db responds quickly.

2 Likes

I see similar things on my server with low CPU, so I don’t think CPU is the issue.

1 Like

I know this caveat.

I thought the db part was on the find part of the graph.
I still have difficulties understanding the difference between find and fetch. Can you help me on that ?

1 Like

The find portion doesn’t actually contact the db, it just constructs the db cursor. So the find should never take much time. So all the time will be in fetch.

Is your server under high load while these subscription traces are recorded? That is pretty much the only thing I can think of that would explain the high latency and high variance in latency of the queries.

1 Like

Either the user document is very large, you did not enable Oplog, or there’s something missing from the code you shared.

A possible error is that your one client has subscribed to the users collection many times (even just a few dozen times, like one subscription per “row” by accident on your client). This will cause a quadratic increase in time to process a simple lookup inadvertently, because each subscription returning results has to merge with other results on that collection, which may require iterating through all of the user’s results.

2 Likes

Is your server under high load while these subscription traces are recorded?

I would say no, but it is by looking at kadira CPU graph, which I have read to be not accurate in a galaxy environment. So it is quite hard to be certain about that.
When I look at galaxy graph, it is also difficult to tell because only the “last 5 minutes” graph is precise, otherwise, values are interpolated and it is hard to find peaks.

What am I beginning to queried is that I unblock all my subs and my methods, so there might be a CPU spike which cannot be seen from Kadira.

Do you think it is a good idea to unblock everything ? My goal is to decrease “wait time” by doing that.

I have Oplog enable, and the user collection is the orginal one, I just add a roles field and a _groupId field to handle multitenancy.

Nevertheless thanks for reminded me about the potentiel quadratic issue.

So far my conclusions have been that I have CPU spikes, maybe due to too much unblocking ( methods and subs ), it is hard to tell because kadira does not register it and galaxy graphs are not helful on that too.

1 Like

I have started seeing the same thing on my end. User find+fetch taking 2000ms, everything slowing down.

I can confirm that it came from our server having unexpected CPU spikes and high RAM usage. Here’s a screenshot from kadira, with a manual restart at ~10:00, that clearly resets RAM and CPU usage.

1 Like

I think you are looking in the wrong place. If I am reading your screen shot correctly, you did 3 find/fetch for the same user ID. 2 were slow >1s, 1 was 128ms.

Who is your DB host? That is the place I think you should be looking.

Second point… And equally important. Why are you doing 3 queries for the same document?!! Perf rule #2, don’t do anything twice that you can do once. (perf rule #1 is don’t do anything once that you don’t have to)

The source code you showed is not the same as the trace, so I have to speculate here. If you are doing Meteor.user() that is bad. If you are, do it once… and store it in a local var.

Better, do Meteor.users.find({_id:…},{fields:{}}) to limit your payload.

1 Like

Hey @oemig, thanks for your answer, I have tried to explain the multiple fetch of user on my first post :

I have realized that in most cases I do not need to pass throught hooks of this package.

In term of Database, I a using Mlab shared plan on the same region as Galaxy server, what metrics should I look at to understand if it is a bottleneck on mLab parts ?
MLab uses Telemetry I am not very familiar with it.

Thanks again for taking the time to answer

@sabativi did you advance in this issue?

I’m with the same problem here. The doc size is just “27” and fetching just a field (_id)
I dont know what to do :frowning:

And my app is using the partitioner package too.
The collection has all index needed.

1 Like

Hey,

Yes and no.

Yes, because in 95% of cases I was able to bypass the find hook that is defined inside the package, by just calling Collection.direct.find

No because I still have 5% of uses cases where this happened.

The next step for me is to try userCache

1 Like

I have this same exact issue and am unable to figure it out. Was about to create a new post about it until I saw this thread. It’s not partial to Meteor.users, I get it on all my collections.

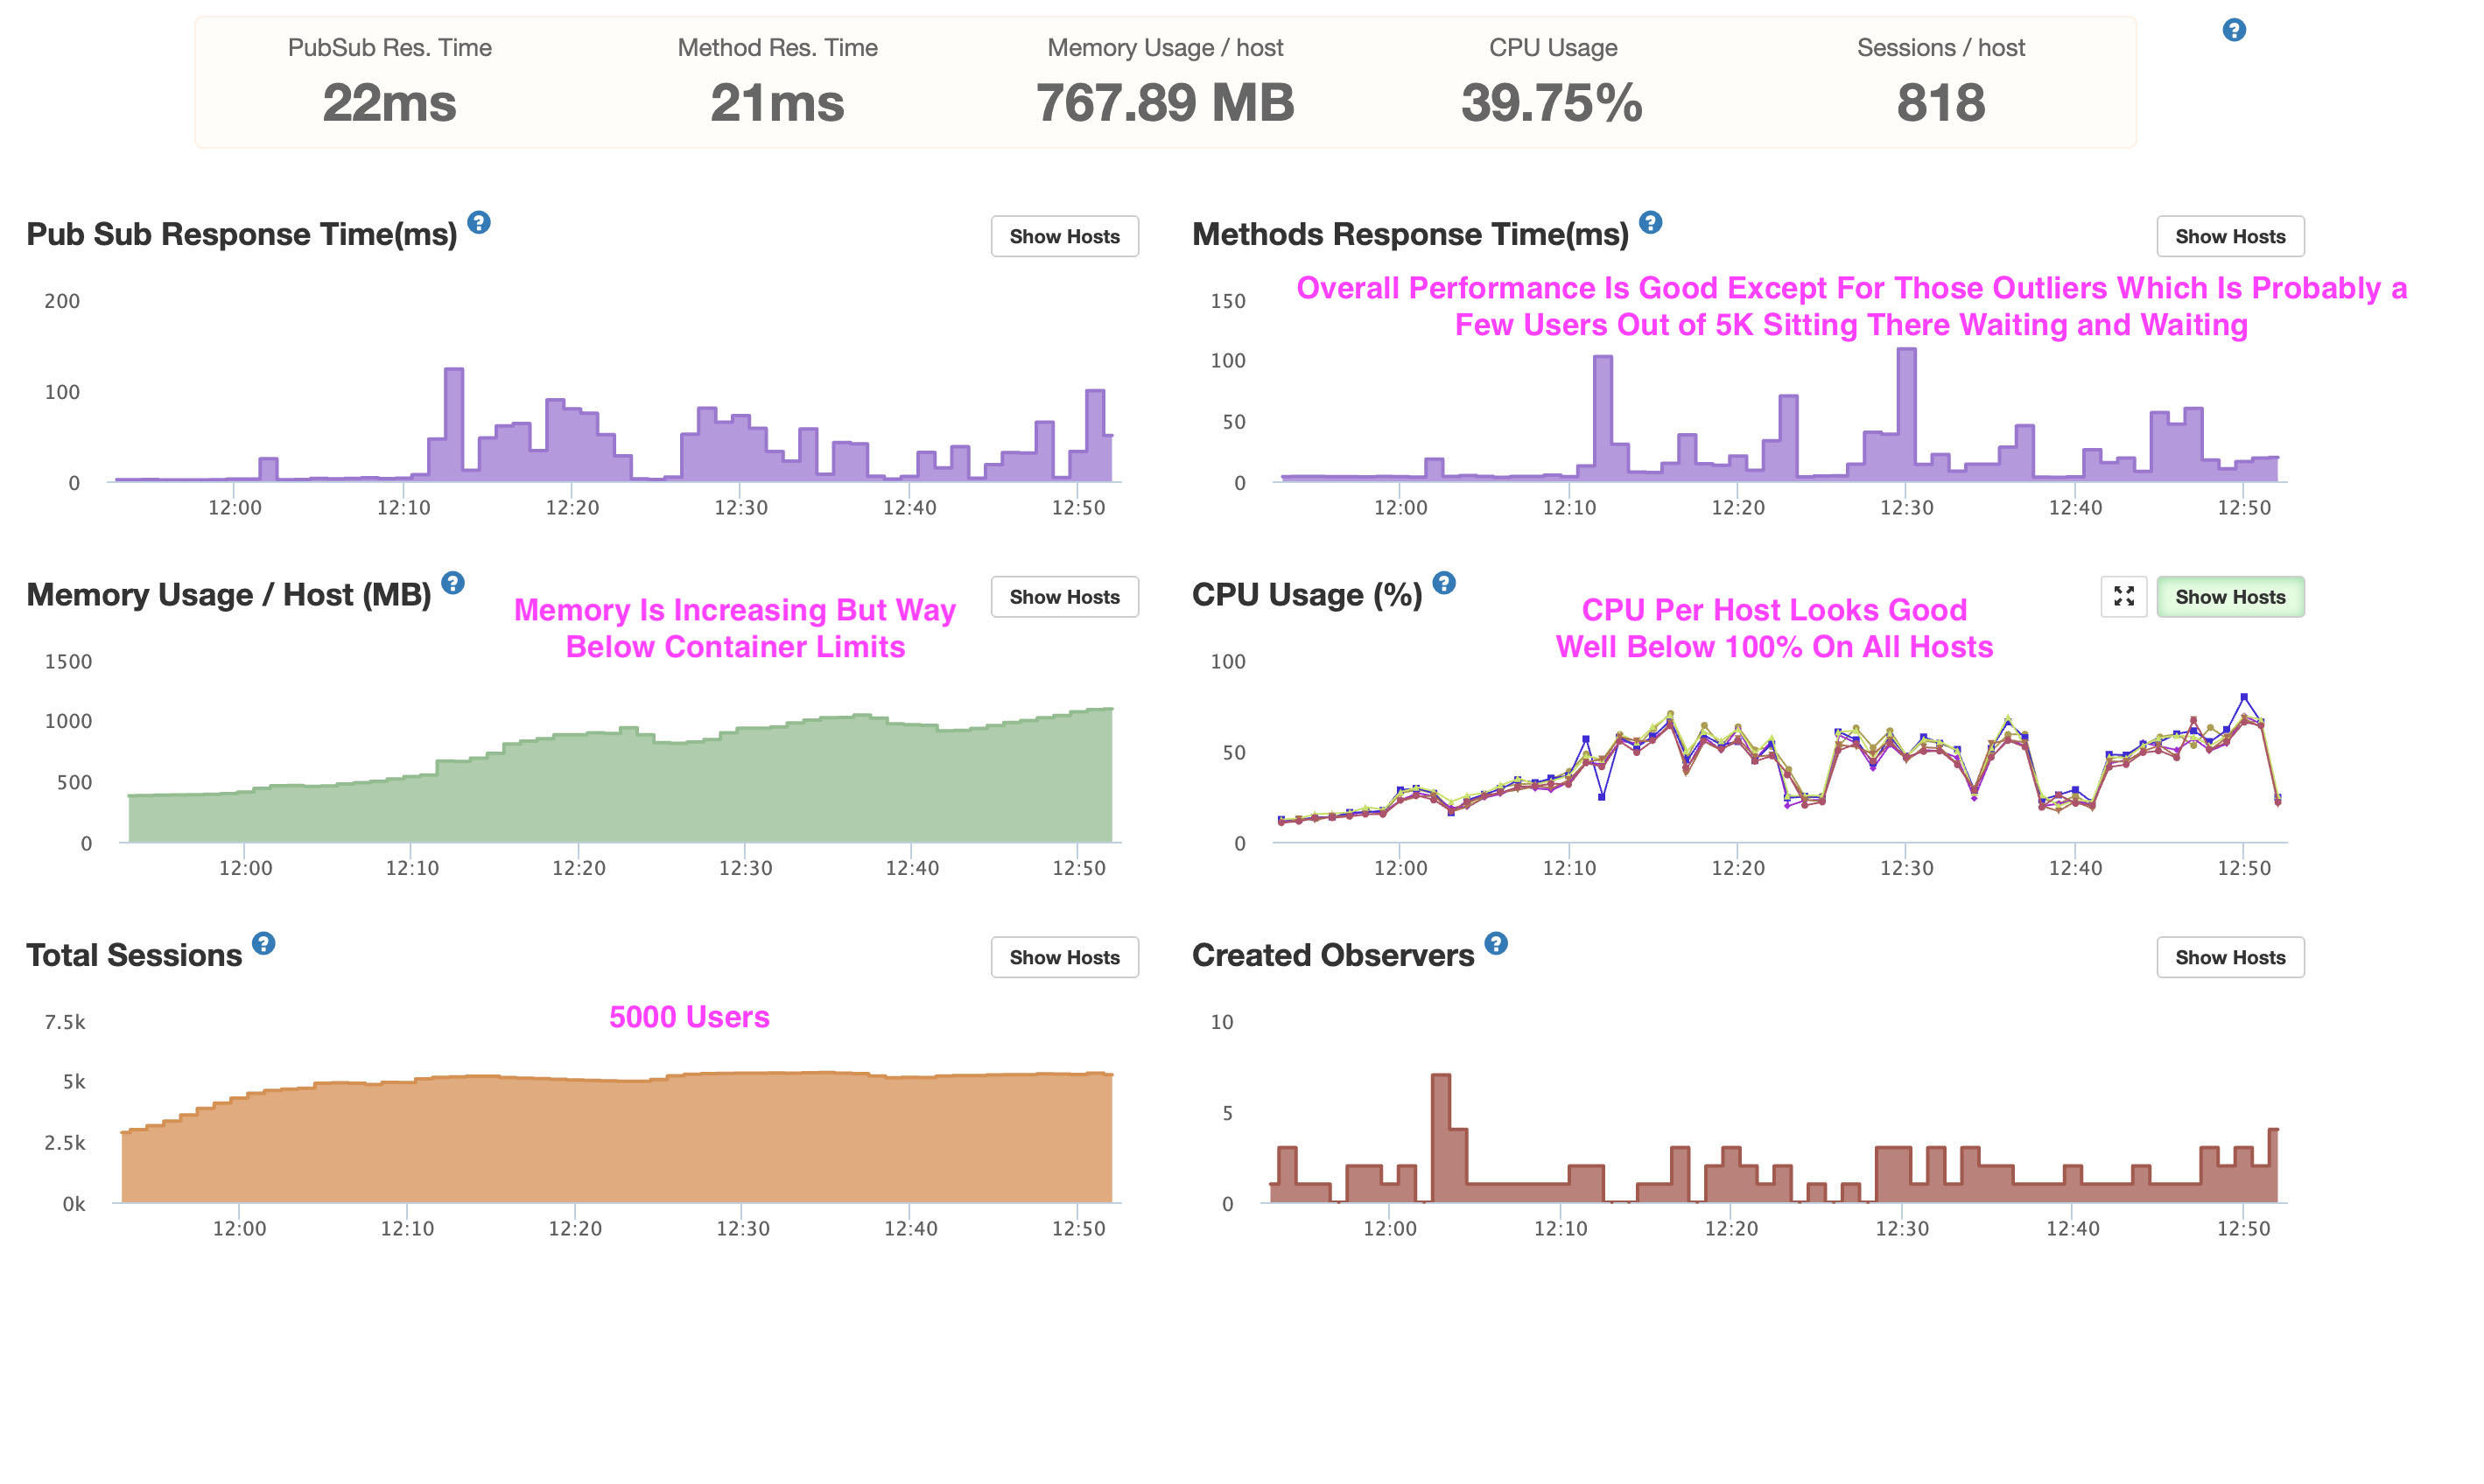
I have a production app that gets bursts of thousands of users at a time. They use the app for a little bit and then leave. I’m running six Galaxy Quad containers. I’m not seeing CPU spiking (at 100% at least) on Galaxy or in Meteor APM. Nor high memory usage. I use Mongo Atlas at the M40 level… so I’m throwing some firepower on this from both the Galaxy Container and Mongo Atlas fronts. My Mongo Atlas reports zero slow queries, zero missing indexes. I have all my indexes set.

My issues are all in the stack traces of Meteor Method calls, not pub/sub (my app uses a bare-minium pub-sub). I use redis-oplog.

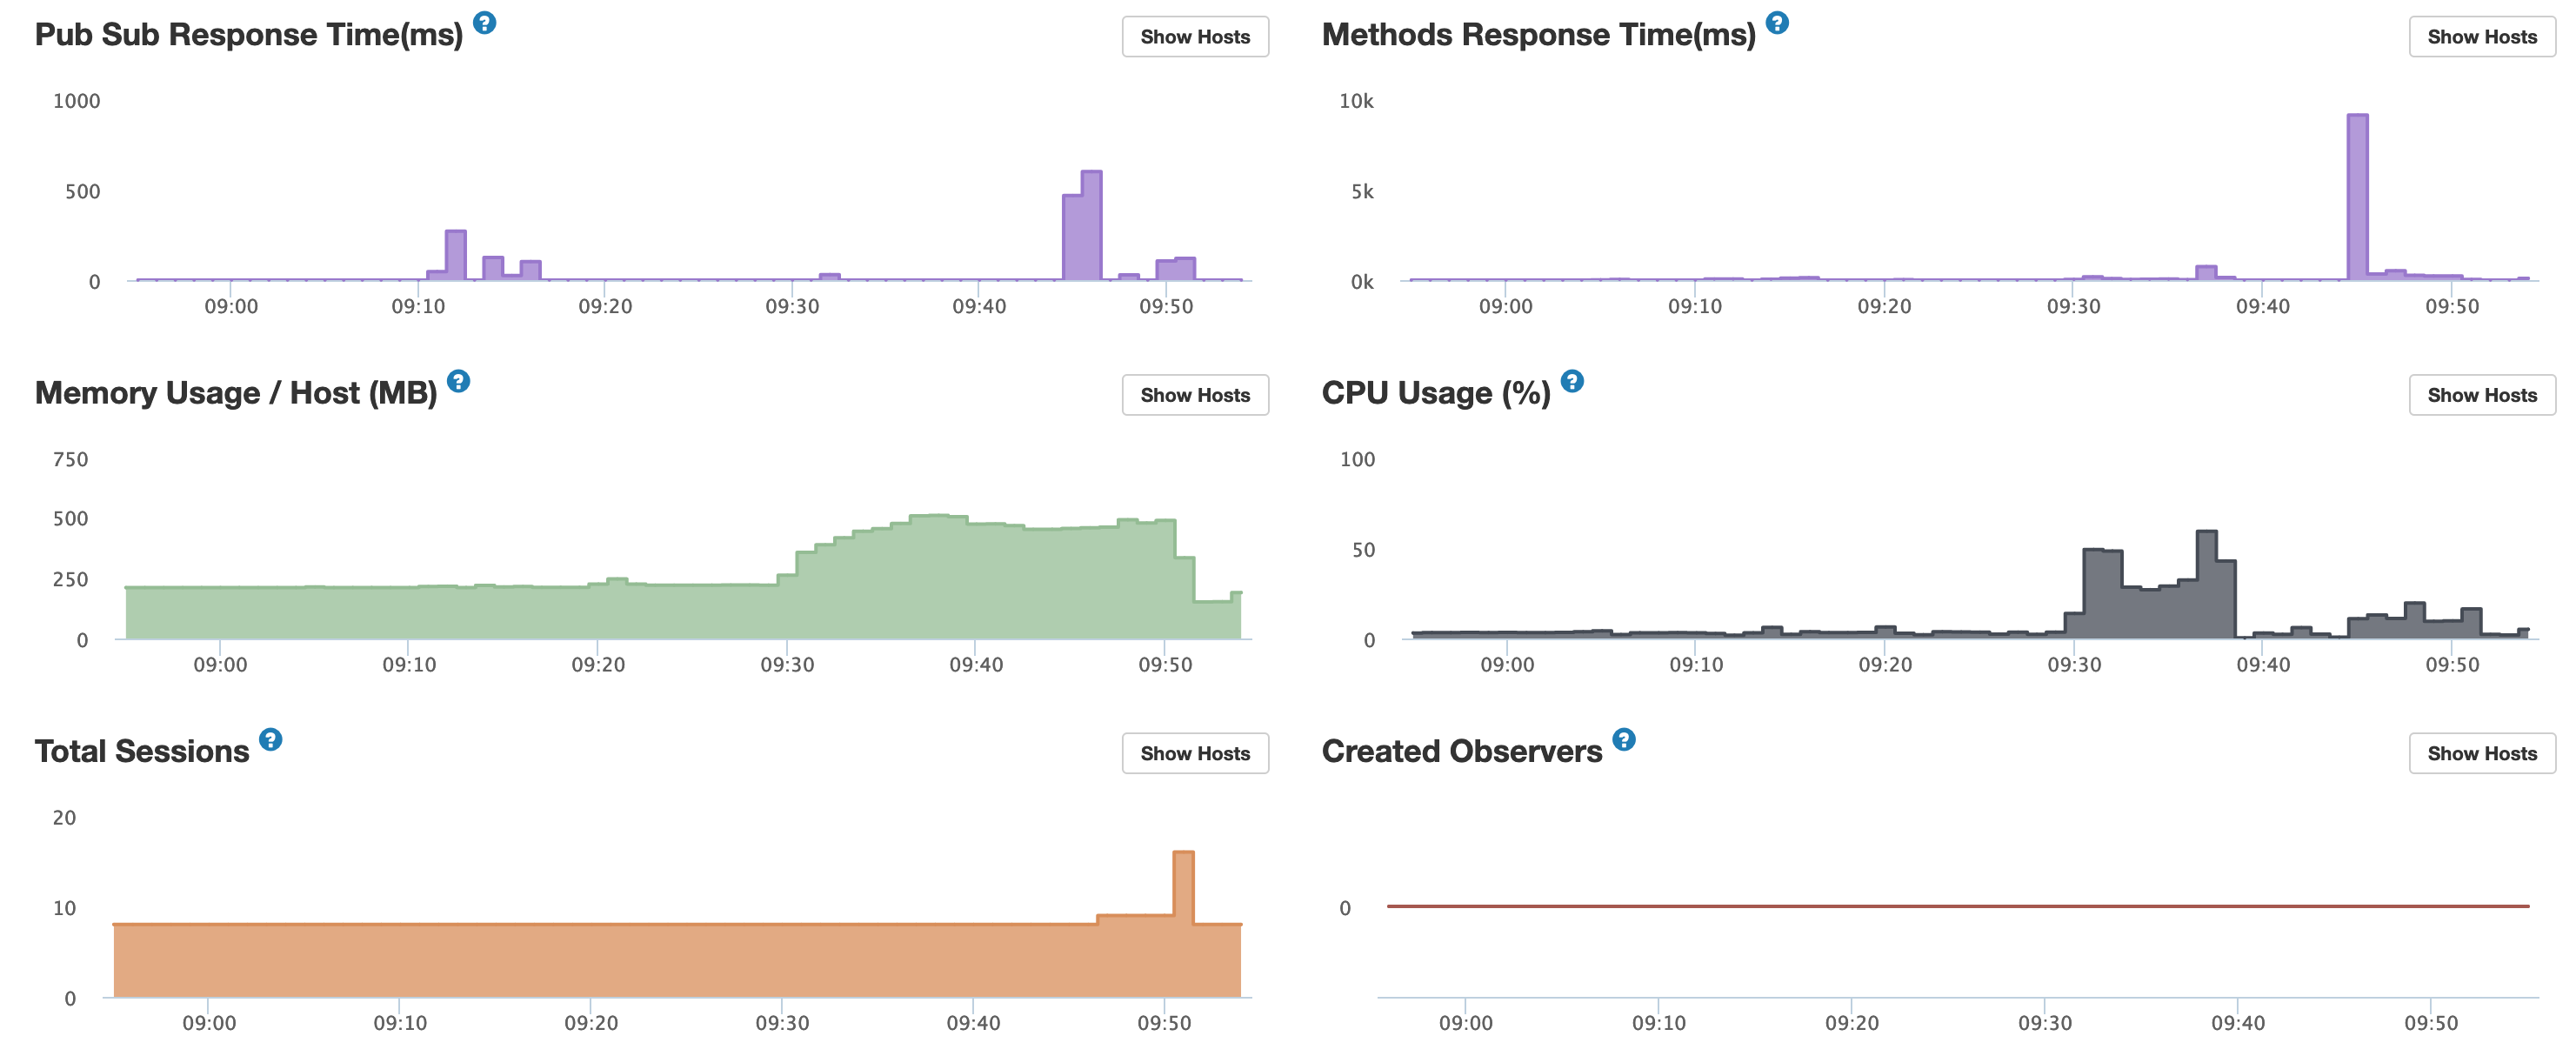
When I click on a spike in the Response Time Breakdown my bars are mostly async (pink) and db (black).

In my Response Time Distribution I’ll see my median, p90, p95, and p99 all be fairly good (less than 500ms) but when I click on a spike, there will be a few stack traces that are crazy high (e.g. 9619ms, 8876ms, often worse, etc.) Not sure why these aren’t shown in the distribution above. I guess this means only very few users are getting these kinds of delays? This would agree with what I’m hearing from our users. If that’s the case, then why are the traces shown only the long ones? Shouldn’t there be some fast ones, even after clicking on a spike?

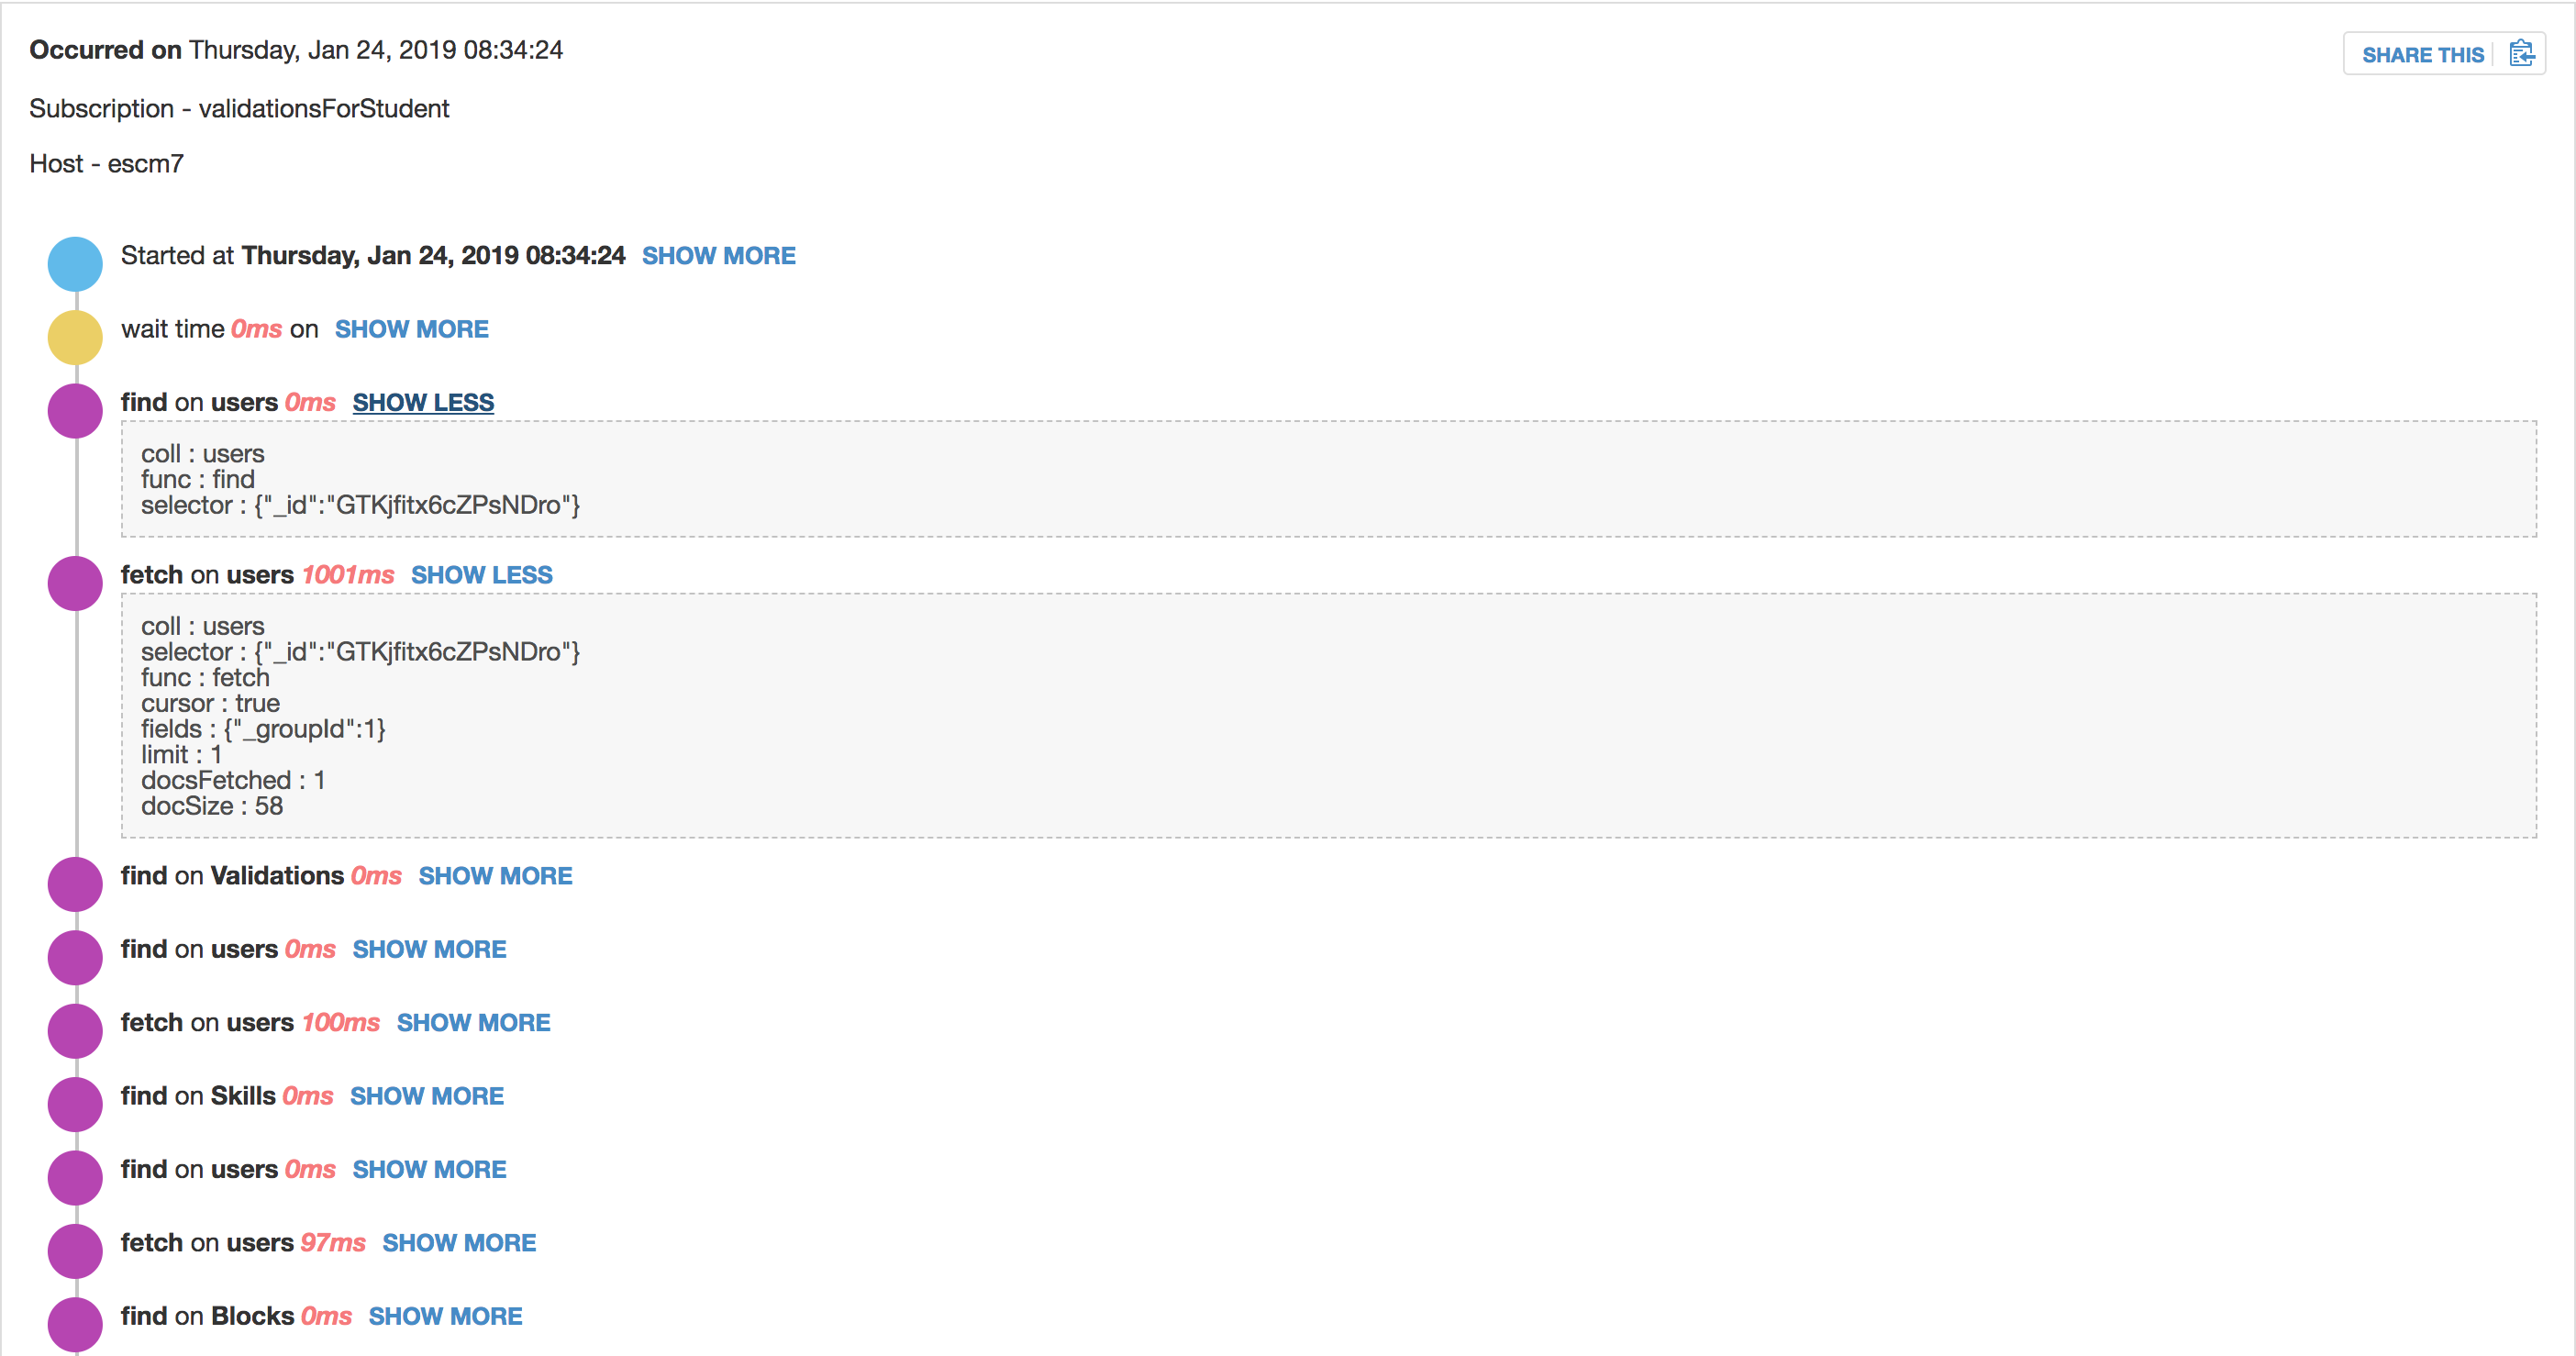
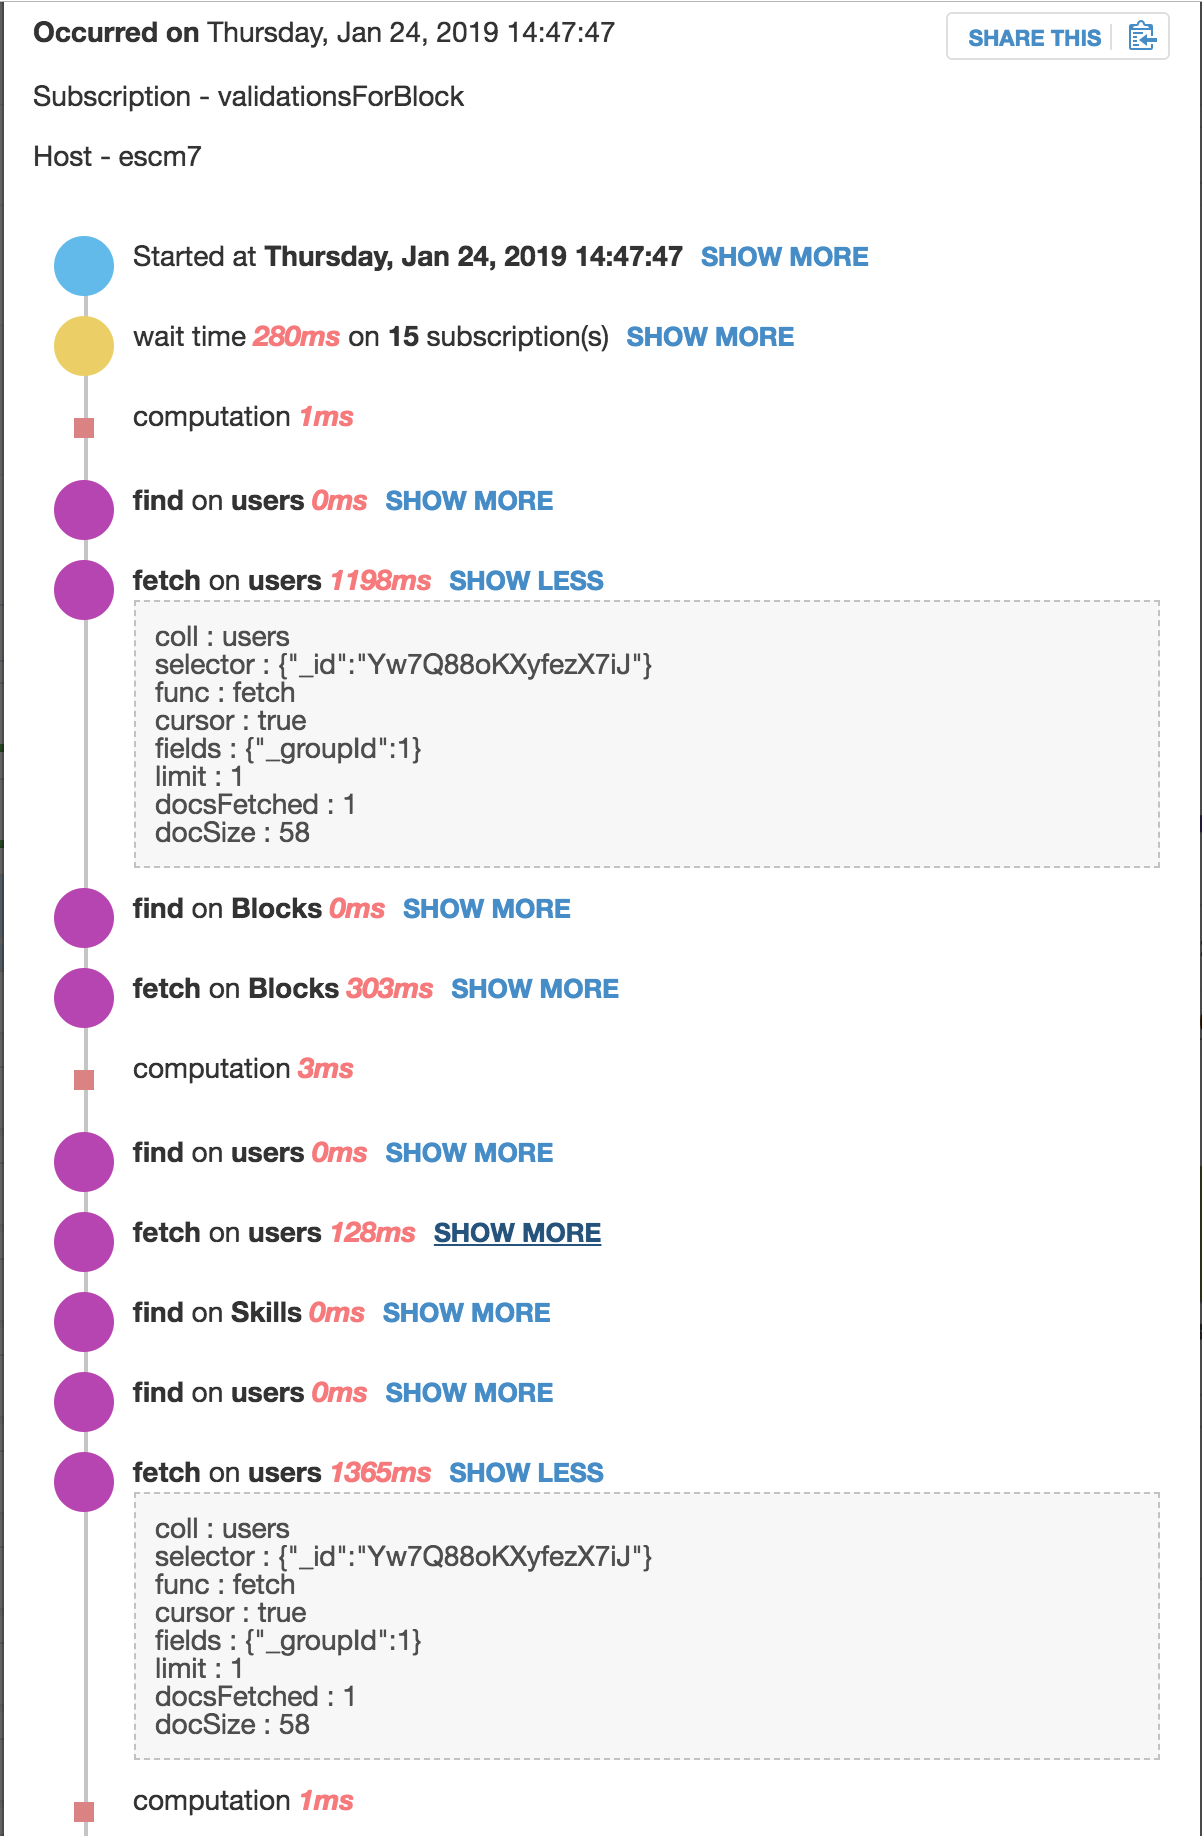
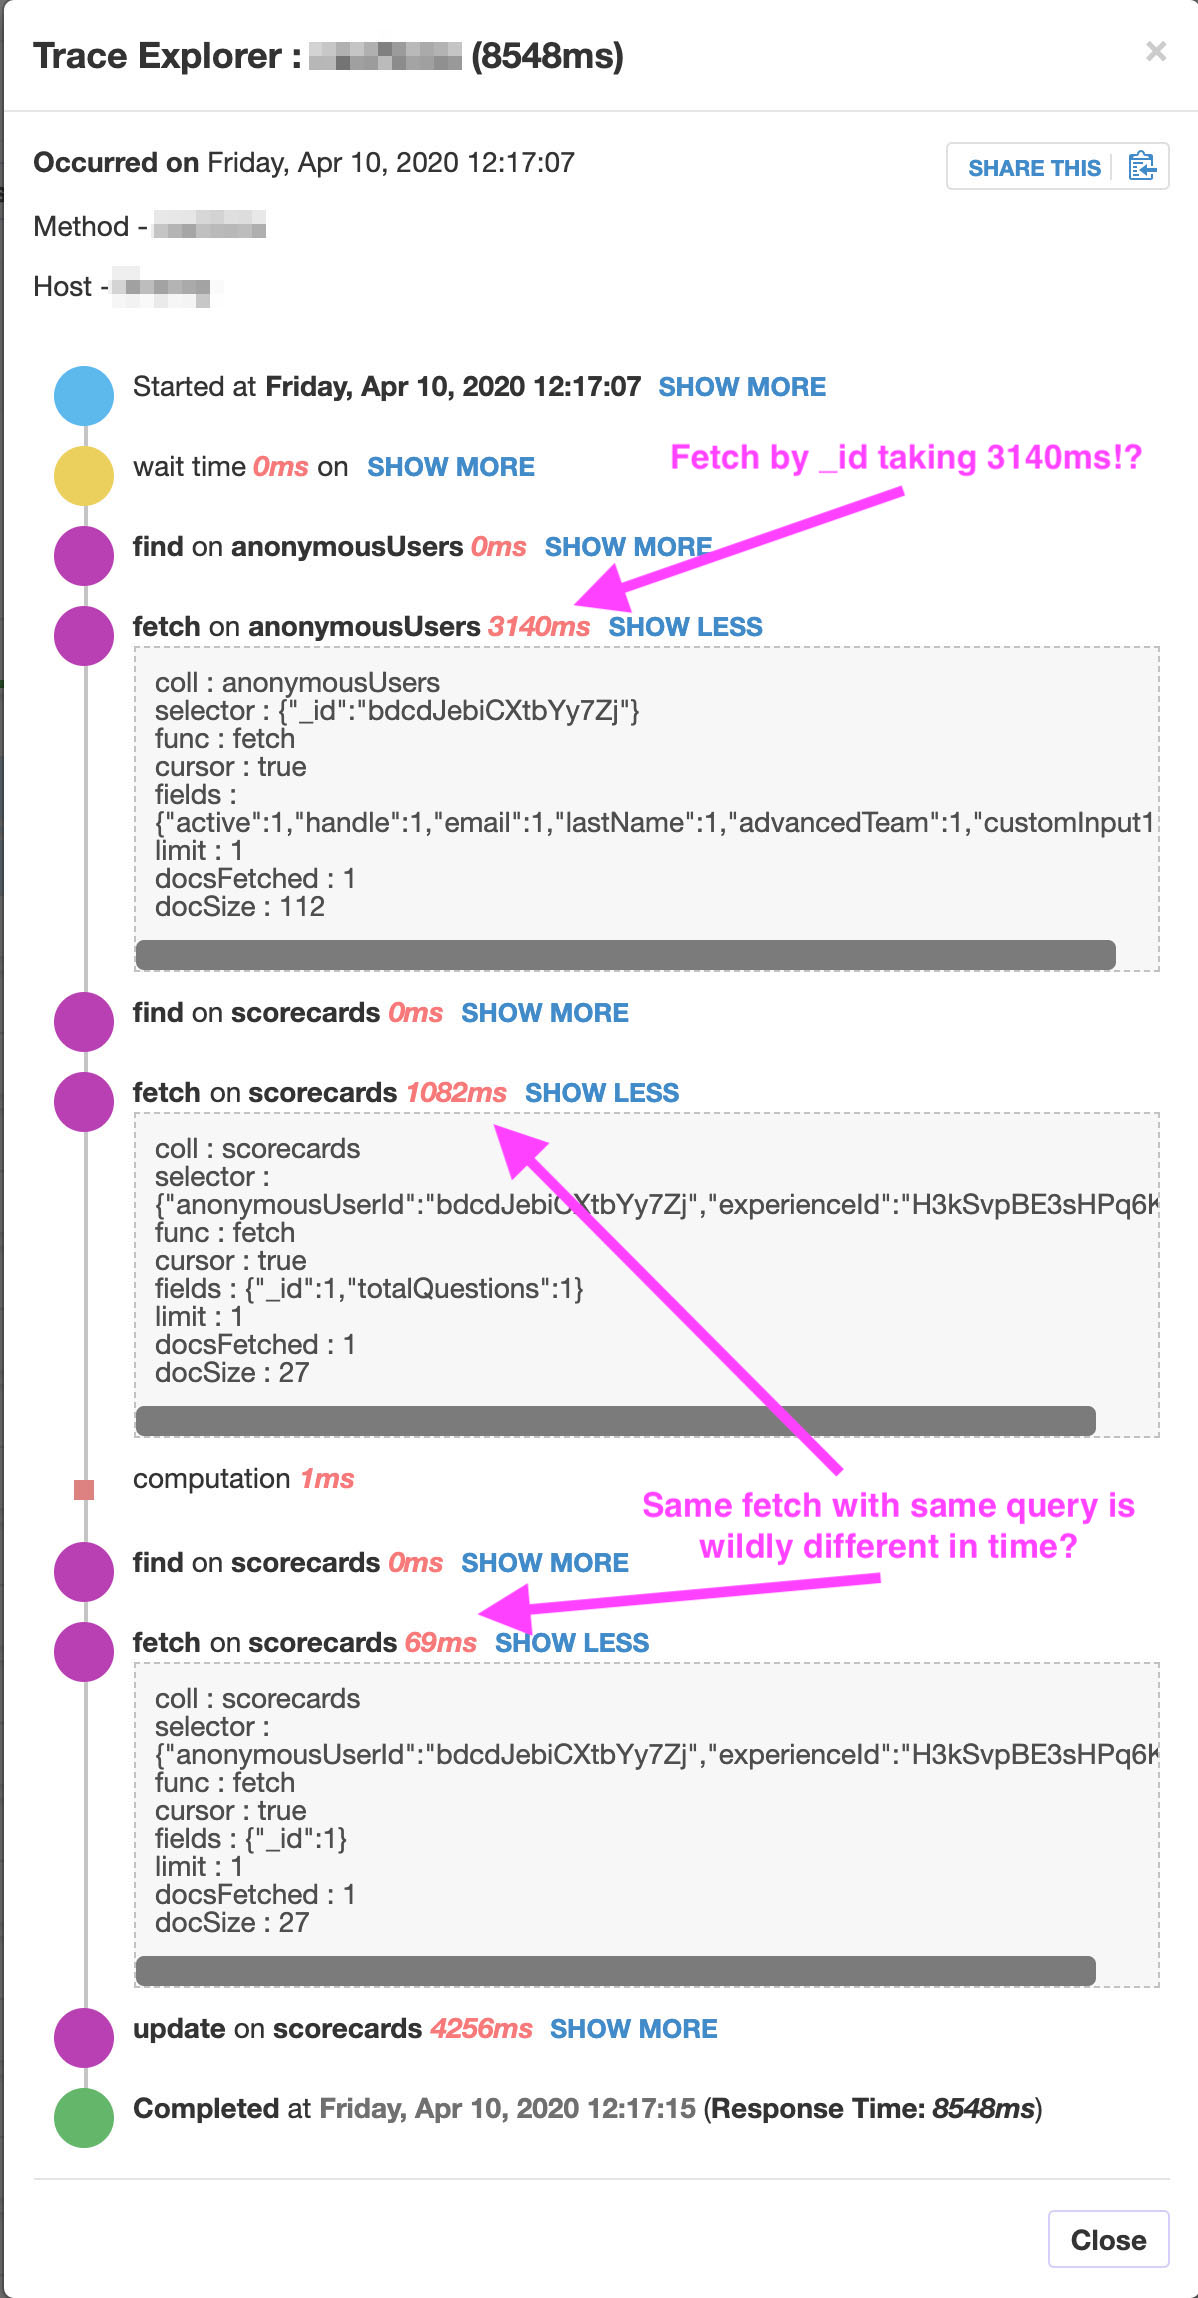
When I click on the long stack trace I’ll see:

  • fetch on a small document (anonymousUsers) by _id taking 3140ms+
  • The same exact query (fetch on scorecards) take 1082ms then later take 69ms in the same method stack trace (similar as OP above). Yes, I know this is weird/bad to query twice but upsert has been broken in simple-schema and collection2 when using autovalue for a while (need to see if this is still the case) this is why I do the same queries twice sometimes. Ignoring that, this illustrates the weirdness of the same exact query taking wildly different times to execute.

My database doesn’t report anything slow, my CPUs don’t seem close to spiking (at least to 100%), same with memory (plenty of both on Galaxy Quads). So I’m not sure what’s going on.

It could be my database hitting IOPS ceilings. It’s limited to 120 IOPS in Mongo Atlas. So maybe queries aren’t slow per se but the database is just being rate-limited basically. Though in Atlas I see the IOPS spiking to the limit but it doesn’t hold there very long. Anyone know about this? Could be the burst of users overloads the IOPS limit of the database? The amount of connections stays constant I assume because it’s still the same amount of containers. Can IOPS limits be busted by the same connections simply requesting more reads and writes?

Or perhaps my containers are truly CPU spiking and it’s just hard to see. I’ll have to watch my containers in Galaxy in the 5m setting (as OP describes) to see if I can see it actually spiking as all other time windows are interpolated. I didn’t get a chance to see that during today’s screenshots.

Whatever the reason, it definitely has to due with high traffic. Just trying to figure out where the bottleneck is. My app is highly optimized but with that kind of traffic, even a small bottleneck could cause issues. Going go back and try to get upsert working again (we recently updated all of our packages so it may be working now).

I’ve been plagued by this issue for years. Finally circling back to try to solve it again.

EDIT In trying to solve this, in all of our methods I have commented out our previous use of unblock everywhere. I was afraid perhaps there was “method thrashing” going one where on method couldn’t complete because others were knocking it out of the way, and so on, or something. This doesn’t seem to have had any affect. Galaxy performance is the same before and after.

BTW, I do see MUCH, MUCH better performance when using vertical scaling (fewer, higher powered Galaxy containers) versus using horizontal scaling (more, lower powered Galaxy containers). My database response times hit the roof with horizontal scaling (tried using 24 Standard containers vs. 6 Quad containers as a test). Not sure why… maybe it had something to do with the amount of connections or something.

2 Likes

There are a lot of things to consider here - unfortunately I don’t have time to go through them all in detail, however, at your request - in brief I’d make the following comments, in no particular order.

  1. Kadira has a weird way of deciding which traces to log (what it considers “outliers” but it isn’t consistent) - it is possible to patch the kadira package to make the threshold for traces lower, or to force traces according to some other policy
  2. “DB” time broadly consists of: EJSON(request) -> network -> BSON(request) -> “actual DB time” -> BSON(response) -> network -> EJSON(response) - or something like that. While you might expect network -> network to be “db”, the EJSON bit on either side often throws people, it is wildly inefficient, particularly if you have a transform as part of your collection (which is useless 99% of the time with publications).
  3. CPU time as reported by Kadira is the average over 1 minute. If you’ve got 50% CPU usage, that might be 50% distributed evenly over the minute, or it might have been totally thrashed for 30 seconds, and completely idle for another 30. More likely, it was thrashing hard for maybe 30 random seconds, it is in these random seconds you may be seeing your spikes.
  4. The network delay of requests from galaxy -> atlas will be variable (in some times very variable) depending on both Galaxy and Atlas’ load.
  5. The IOPS required by mongo is complicated. https://www.mongodb.com/blog/post/maximizing-mongodb-performance-on-aws suggests 1000 IOPS for data, 250 for journal and 100 for logs. So your 120 (probably for journal + data) is low, but it is entirely based on your usage - how many writes do you see per second? Are you using burstable IOPS or provisioned? How much data do you read that is outside your working set?
  6. Be absolutely 100% sure that you are not hitting memory limits. Look at individual server stats, NOT average, see if you can track the problem down to a single serve. Check that meteor has available all the memory the container has (not sure if Galaxy does this for you). Meteor gets completed pegged as it approaches 95% memory usage.
  7. Caching in the app side will do no good if you’re hitting an IOPS limit in mongo AND you’re doing the same number of writes. If you find IOPS are the problem, raise it - or change your schema to batch requests - the closer you are to a 4KB packet, the better you’ll utilise your given IOPS.
  8. Sanity check (regarding your comments on vertical vs horizontal) - you 100% sure you removed standard oplog? Just because you’re using redis doesn’t mean you aren’t still processing mongo oplog.
  9. Assuming 8 is good - redis-oplog doesn’t do much good in the case where all your servers are subscribed to all your collections by anything other than _id - in the case of _id there are some optimizations, but in all other cases, each server will still receive every update on a collection if it has ANY non _id observers. Consider using channels so each server subscribes to a subset of data - if you can route clients to specific servers based on these channels (or an approximation of it) then great!
  10. See if you can figure out what the async work is - this might be the literal sending of data down the pipe to the clients. Depending on your setup, a method call may “track” the updates it causes to populate to ALL clients that needed those documents - if you’re using unblock, this shouldn’t impact performance as observed by the client, but it’s something I’ve got a PR against with redis-oplog, cos it seems like it shouldn’t be done this way.
  11. Consider using covered indexes/queries - this is an index where the entire result is stored in the index (use sparingly of course). For this to work, all the fields in the projection AND the selector must be included in the index - this makes sense if your documents are very small. By doing this mongo is able to skip over the entire “fetch” and “project” stages in its query (see the query planner). So this can be much faster. Be sure to include _id even if you don’t care about it - cos meteor won’t let you skip it!

My money is on a combo of IOPS and CPU spiking. Do you have access to the raw AWS logs for your mongo containers? There you can see max CPU usage in a given 1 minute window, basically if it’s ever 100 - you’ve got a spike. Similarly you’ll be able to see if you’re pegging your IOPS

4 Likes