Unfortunately I don’t see anything in the Meteor APM that shows what’s causing high CPU consumption. Other than just doing git bisect and re-deploying over and over till the bad code is found, is there some other way I can find out what’s causing the app to run hot?
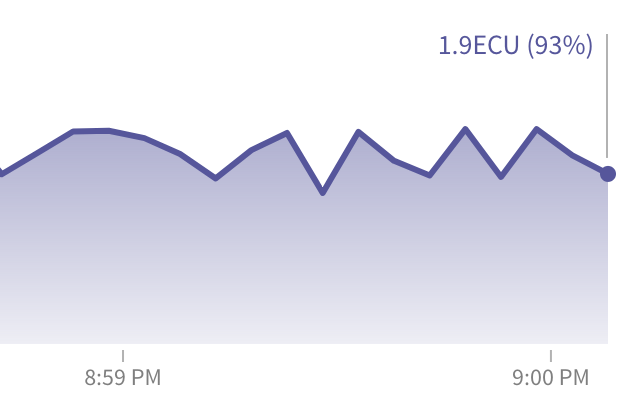
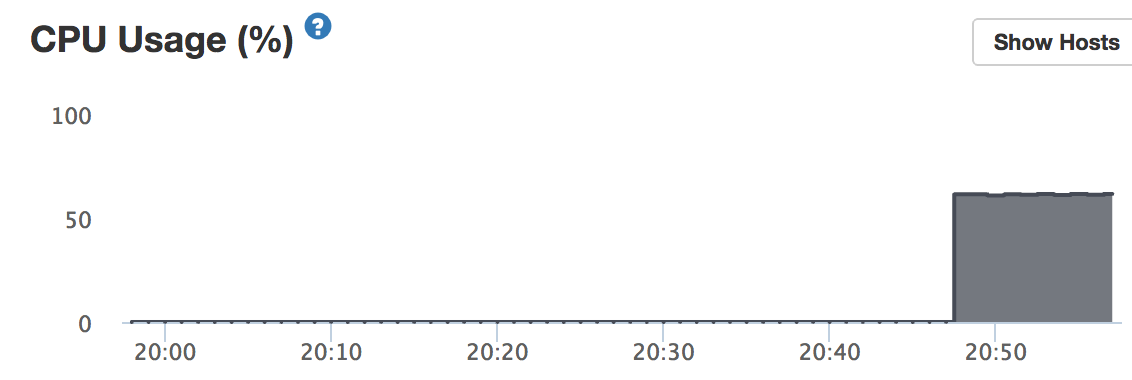
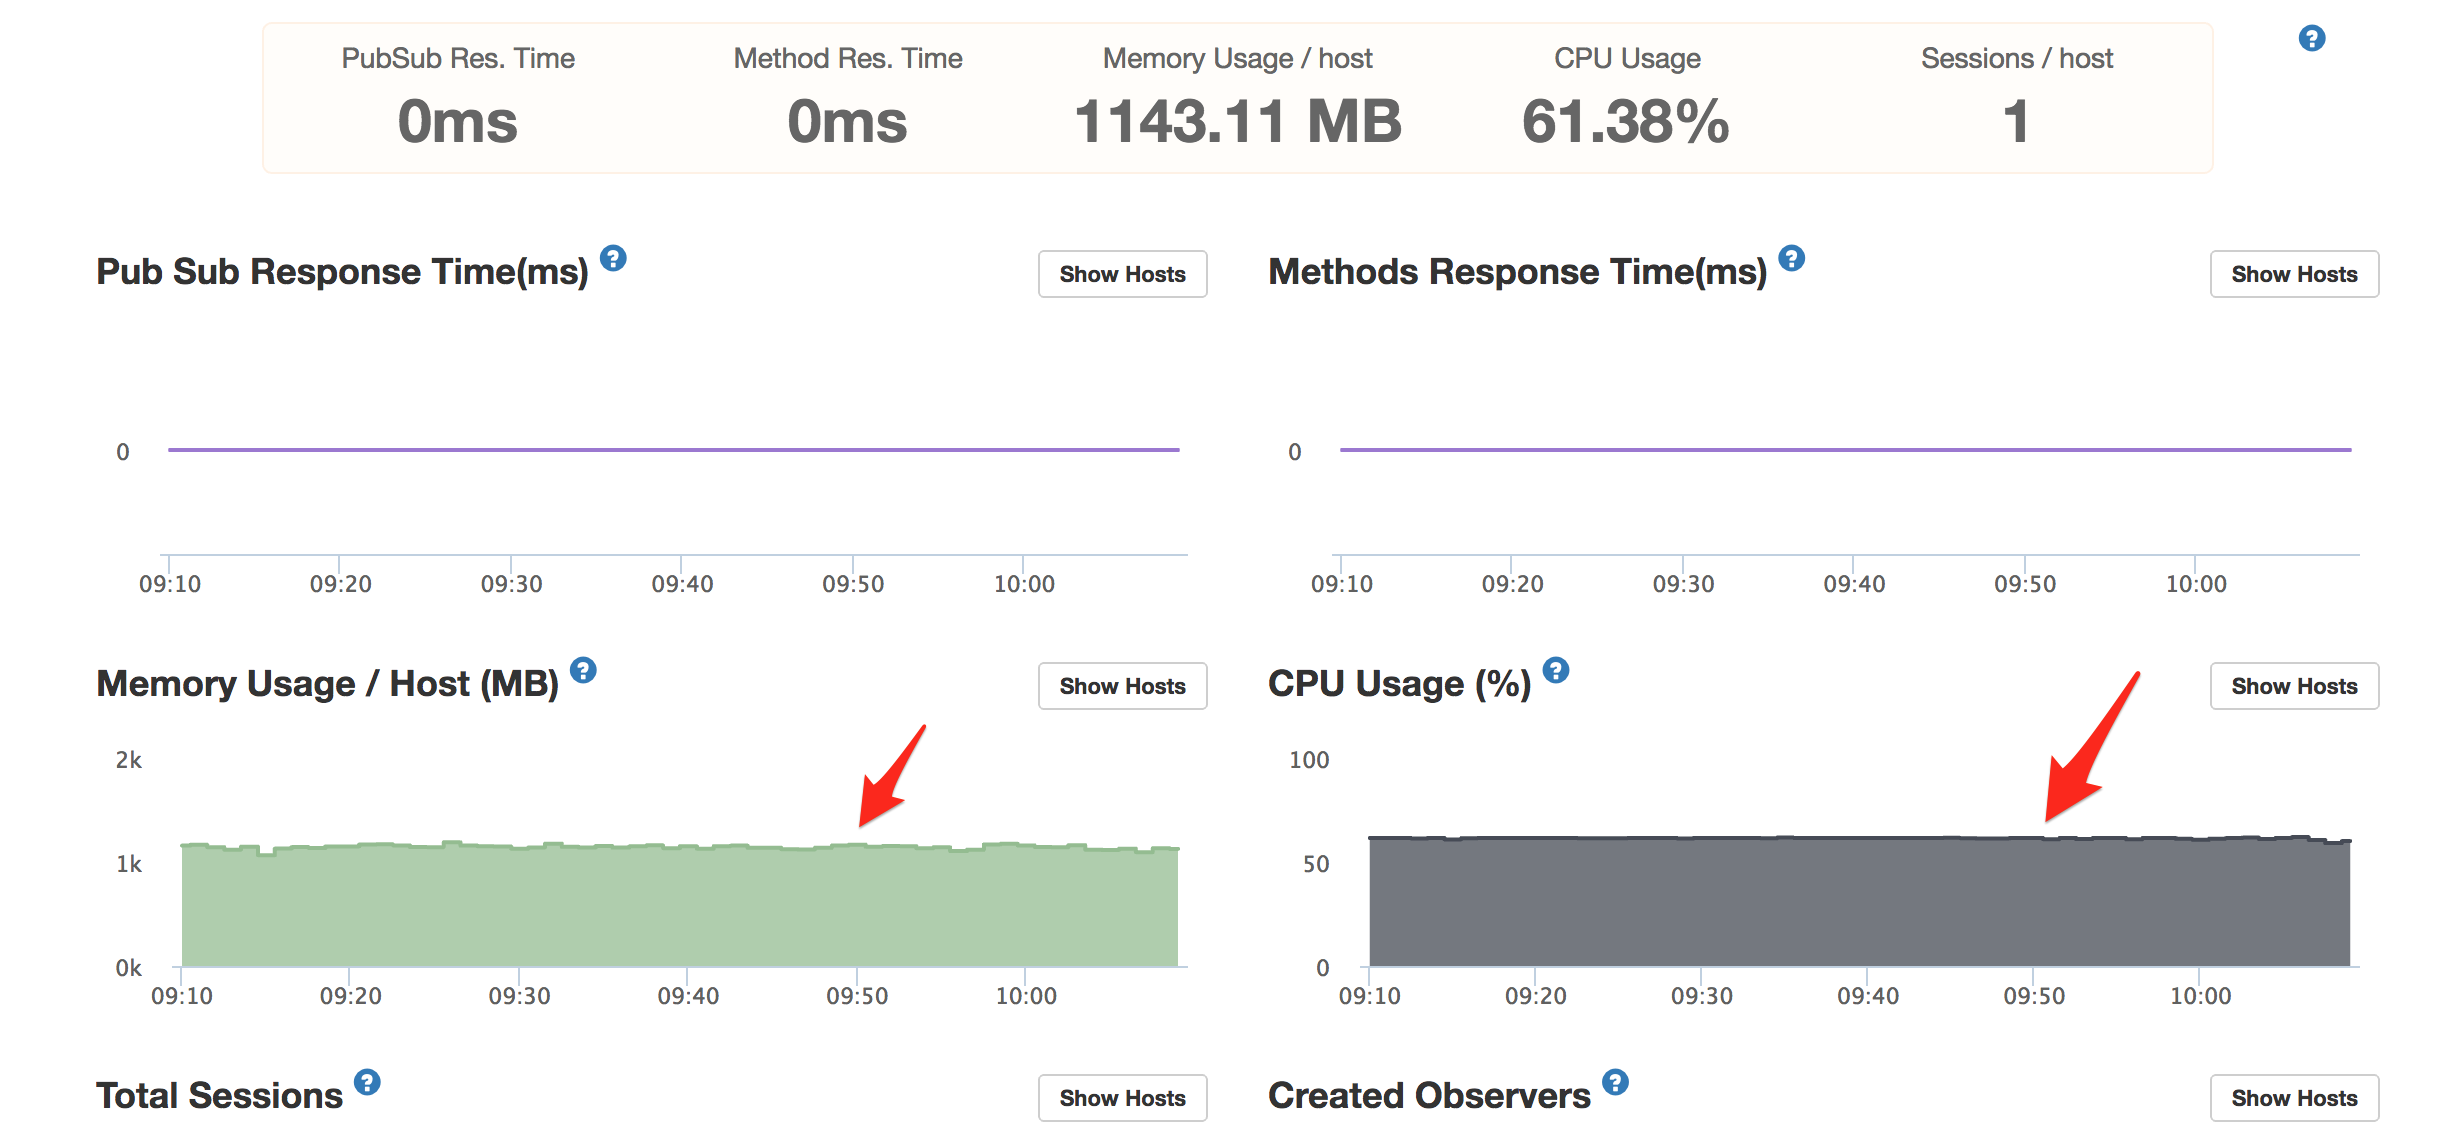
Even idling, the app is consuming large amounts of CPU & RAM! Which actually sucks, because in the Meteor APM, all the pub/sub and method call responses are normal… or actually zero, because nothing is happening. Yet, resources are being burned.
Ok, so apparently the culprit was Cursor.observe() on a rather large collection. I had some cursor observers set up to watch for any change in a few collections, and then automatically create search keywords (in an array, on that document). As a workaround, I’ll have to just put the search keyword generation logic elsewhere, and kill the .observe() calls. Though I can’t help but wonder if there’s a more efficient way to use .observe() when you have a collection of 20,000+ records?
Just a hunch. I commented out all my observe calls that happened upon server startup, and that fixed the issue. Granted, it wasn’t the wisest thing to observe collections that have tens of thousands of records…
I’d create a microservice for something like that. Of course it depends on the use case, but a cron job could be a solution. Every minute (or less) find all documents that don’t have the field you’re using for search keywords, then generate them.
In essence this would mean removing reactivity and running the query every x amount of time. Depending on the query and collection indexes I’m sure you’d be able to improve the performance of .observe() though.
Another implementation solution would be some kind of hook. Instead of listening for changes for that cursor, trigger an action right after your insert/update logic.