Protobuf needs to be de-serialized, I am not sure it would be more performant than simple json. I would really research and test this before investing into implementation. Maybe there are some new browser api’s that could do deserialization natively idk, but if done in js it probably won’t give any big wins and introduce complexity.
For those who want to work on it, understand DDP pkg could be a good point of start, here and here you can find a guide
@ignl but what do you think to do an benchmark comparing ws, sockjs and uws and talk about the diffenreces between them, it will be a good content for the dev community and for who want to do a poc like this. It will a required knowledge for who want to work on it
I’ve been working on the benchmarking side of things and built a framework on top of the existing meteor/performance repo that could help with some of the questions raised here (measuring the impact of change streams, etc.).
Live dashboard: https://meteor-benchmark-dashboard.sandbox.galaxycloud.app/
Fork: GitHub - dupontbertrand/performance at feature/benchmark-framework · GitHub
What it does
-
A
bench.jsCLI that runs Artillery+Playwright scenarios against any Meteor checkout, collects CPU/RAM/GC metrics, compares two branches and detects regressions -
GC tracking via Node.js
perf_hooks(zero overhead when disabled) -
A Blaze dashboard on Galaxy to visualize runs, compare branches, and track trends over time
-
GitHub Actions workflows for automated PR and nightly benchmarks
There’s already data in the dashboard for release-3.2 through release-3.5 and devel. For example, devel vs release-3.5 shows nearly identical performance on the light scenario, with devel having slightly better GC behavior (−31% max pause, −34% major GC time)
This is still very much a draft/experimental setup — benchmarks are running on shared GitHub Actions runners (no dedicated VM), so the numbers have some variance. But the framework itself is functional end-to-end: run, compare, push to dashboard, CI automation. Happy to iterate on it if the team finds it useful ![]()
![]()
6 Likes
Give this man a baguette!! ![]()
![]()
![]()
2 Likes
This was exactly the longer-term vision I expected for meteor/performance: making it more dynamic and allowing easy checks between branches, different app examples and setups, multiple metrics, and so on.
Still, the app there is really basic and does not cover many real-world scenario behaviors (I will continue and intent here - I will try with Claude, I invoke you! ![]() ). But we can scale the performance app overtime, and with that the benchmark suite UI will be a good asset to compare changes and ensure we do not go backwards.
). But we can scale the performance app overtime, and with that the benchmark suite UI will be a good asset to compare changes and ensure we do not go backwards.
This dashboard opens also the possiblity to test the bundler scenario with meteor profile and check over versions we don’t go backwards in those terms. ![]()
I completely support the direction of your changes.
benchmarks are running on shared GitHub Actions runners (no dedicated VM), so the numbers have some variance.
Don’t worry we can improve that later with dedicated machines to get more stability on numbers, the idea is the direction to go.
3 Likes
Nice! This is something I was trying to do with OpenTelemetry, but you’re following a better path than I was. I really loved the live dashboard; I can definitely see it in our release pipeline one day.
I have a few questions:
Such a great tool. Squash the “meteor doesn’t scale” rhetoric.
4 Likes
Quick update on the benchmark work: the benchmark framework is now merged into dupontbertrand/performance on main , and the dashboard is live here: https://meteor-benchmark-dashboard.sandbox.galaxycloud.app ![]()
It currently covers:
- browser-based reactive scenarios
- DDP-only scenarios
- reactive fanout
- cold start
- bundle size
I also added CI workflows for nightly runs, branch vs baseline comparisons, and transport comparisons like SockJS vs UWS ![]()
The dashboard has evolved quite a bit too. It now has a proper Release Health view, compare pages, trends, run detail pages, scenario detail pages, and more context around what each metric means.
Current tags/data include:
release-3.2release-3.3release-3.4release-3.5develrelease-3.5-sockjsrelease-3.5-uws
@italojs To answer your questions directly:
1. Is the server running in the same environment as Artillery?
Yes, for now the Meteor app and the load generator run on the same machine, either on the same GitHub Actions runner in CI or on the same laptop locally.
That works well enough for relative comparisons on the same setup , but not for production-like absolute numbers, since the load generator also competes with the app for CPU and RAM. So for the 3.4 → 3.5 CPU differences some users reported, a split setup would definitely be cleaner: Meteor on one machine, load generation on another.
2. Do I have plans to test only the backend?
Yes, and that part is already in place ![]()
I added backend-only scenarios:
ddp-reactive-light/ddp-non-reactive-light
SimpleDDP clients over raw WebSocket, no browser, to isolate DDP throughputfanout-light/fanout-heavy
50 or 200 subscribers + 1 writer, measuring reactive propagation latency (p50,p95,p99,max)
I also added CLI-only benchmarks for:
cold-startbundle-size
So the current setup now covers browser/full-stack, backend-only, reactive fanout, and startup/build benchmarks.
The main next step now is improving signal quality:
- more datapoints
- less noise
- ideally a dedicated machine instead of shared runners
So there’s still a lot to refine, but it’s starting to feel like something genuinely useful rather than just a pile of benchmark scripts ![]()
3 Likes
This is so cool. Fantastic job on this!
Edit: Something that may be of interest for developers who have not migrated to 3.x yet is a baseline comparison of 2.16?
1 Like
Are all these tests using oplog tailing? Should 3.5 also have change streams support to measure 3.4 oplog tailing vs 3.5 change streams?
https://meteor-benchmark-dashboard.sandbox.galaxycloud.app/scenario/reactive-light
Measuring 2.x vs 3.x is turning out to be a bit more complicated than expected, but I’ll get there ![]()
And regarding oplog vs. change streams, yes, I can run both tests just like I did for SockJS vs. uWS ![]()
But until we have a dedicated machine, the metrics are completely skewed ![]()
2 Likes
IMO we should focus in make benchmark toolkit stable for 3.x first, as I can see still have so much to do to mensure 3.x, metrics, scenarios, pkgs…
1 Like
I’m in favor of totally dropping 2.x. It’s a piece of history now. So don’t waste your time focusing on it.
3 Likes
Not trying to cast stones but sharing this for the broader community but the official stance now is no 2.x releases. Not even backports, fixes or any improvements to ease migrations. So makes no sense @dupontbertrand for you to try to get readings on performance. Drop 2.x.
2 Likes
Fiooou, quite a Saturday. Here’s what happened today on the benchmark front.
Dedicated server
We now have a Hetzner CPX42 (8 vCPU AMD EPYC, 16 GB RAM, Nuremberg) running nothing but benchmarks. No desktop, no GUI, no cron jobs, no shared runners. Just Meteor, MongoDB, and Artillery.
MongoDB 7.0 and Node 22 — same versions as Meteor’s dev bundle.
Server tuning
Getting reliable numbers took a few iterations. Here’s what we ended up with:
- CPU pinning — Meteor gets cores 0-3, Artillery/Chromium gets cores 4-7 via
taskset. They don’t fight for CPU anymore. - MongoDB restart between each scenario — clears WiredTiger cache and open cursors so each scenario starts fresh.
- Filesystem cache drop between scenarios —
echo 3 > /proc/sys/vm/drop_caches - 5-second cooldown between scenarios for the OS to settle
- Parasitic services disabled — apt-daily, fstrim, motd, all turned off
This made a huge difference. Our early runs had GC max pauses of 5+ seconds that turned out to be just noise from lack of isolation. With the setup above, the same metric dropped to ~40ms. Lesson learned: benchmark methodology matters more than the numbers themselves.
Two repos
We split things into two private repos:
- bench-dashboard — the Blaze dashboard app, deployed automatically to Galaxy via push-to-deploy
- meteor-bench-agent — the benchmark CLI, scenarios, collectors, and the polling agent that runs on the server
The old performance repo is archived.
How it all connects
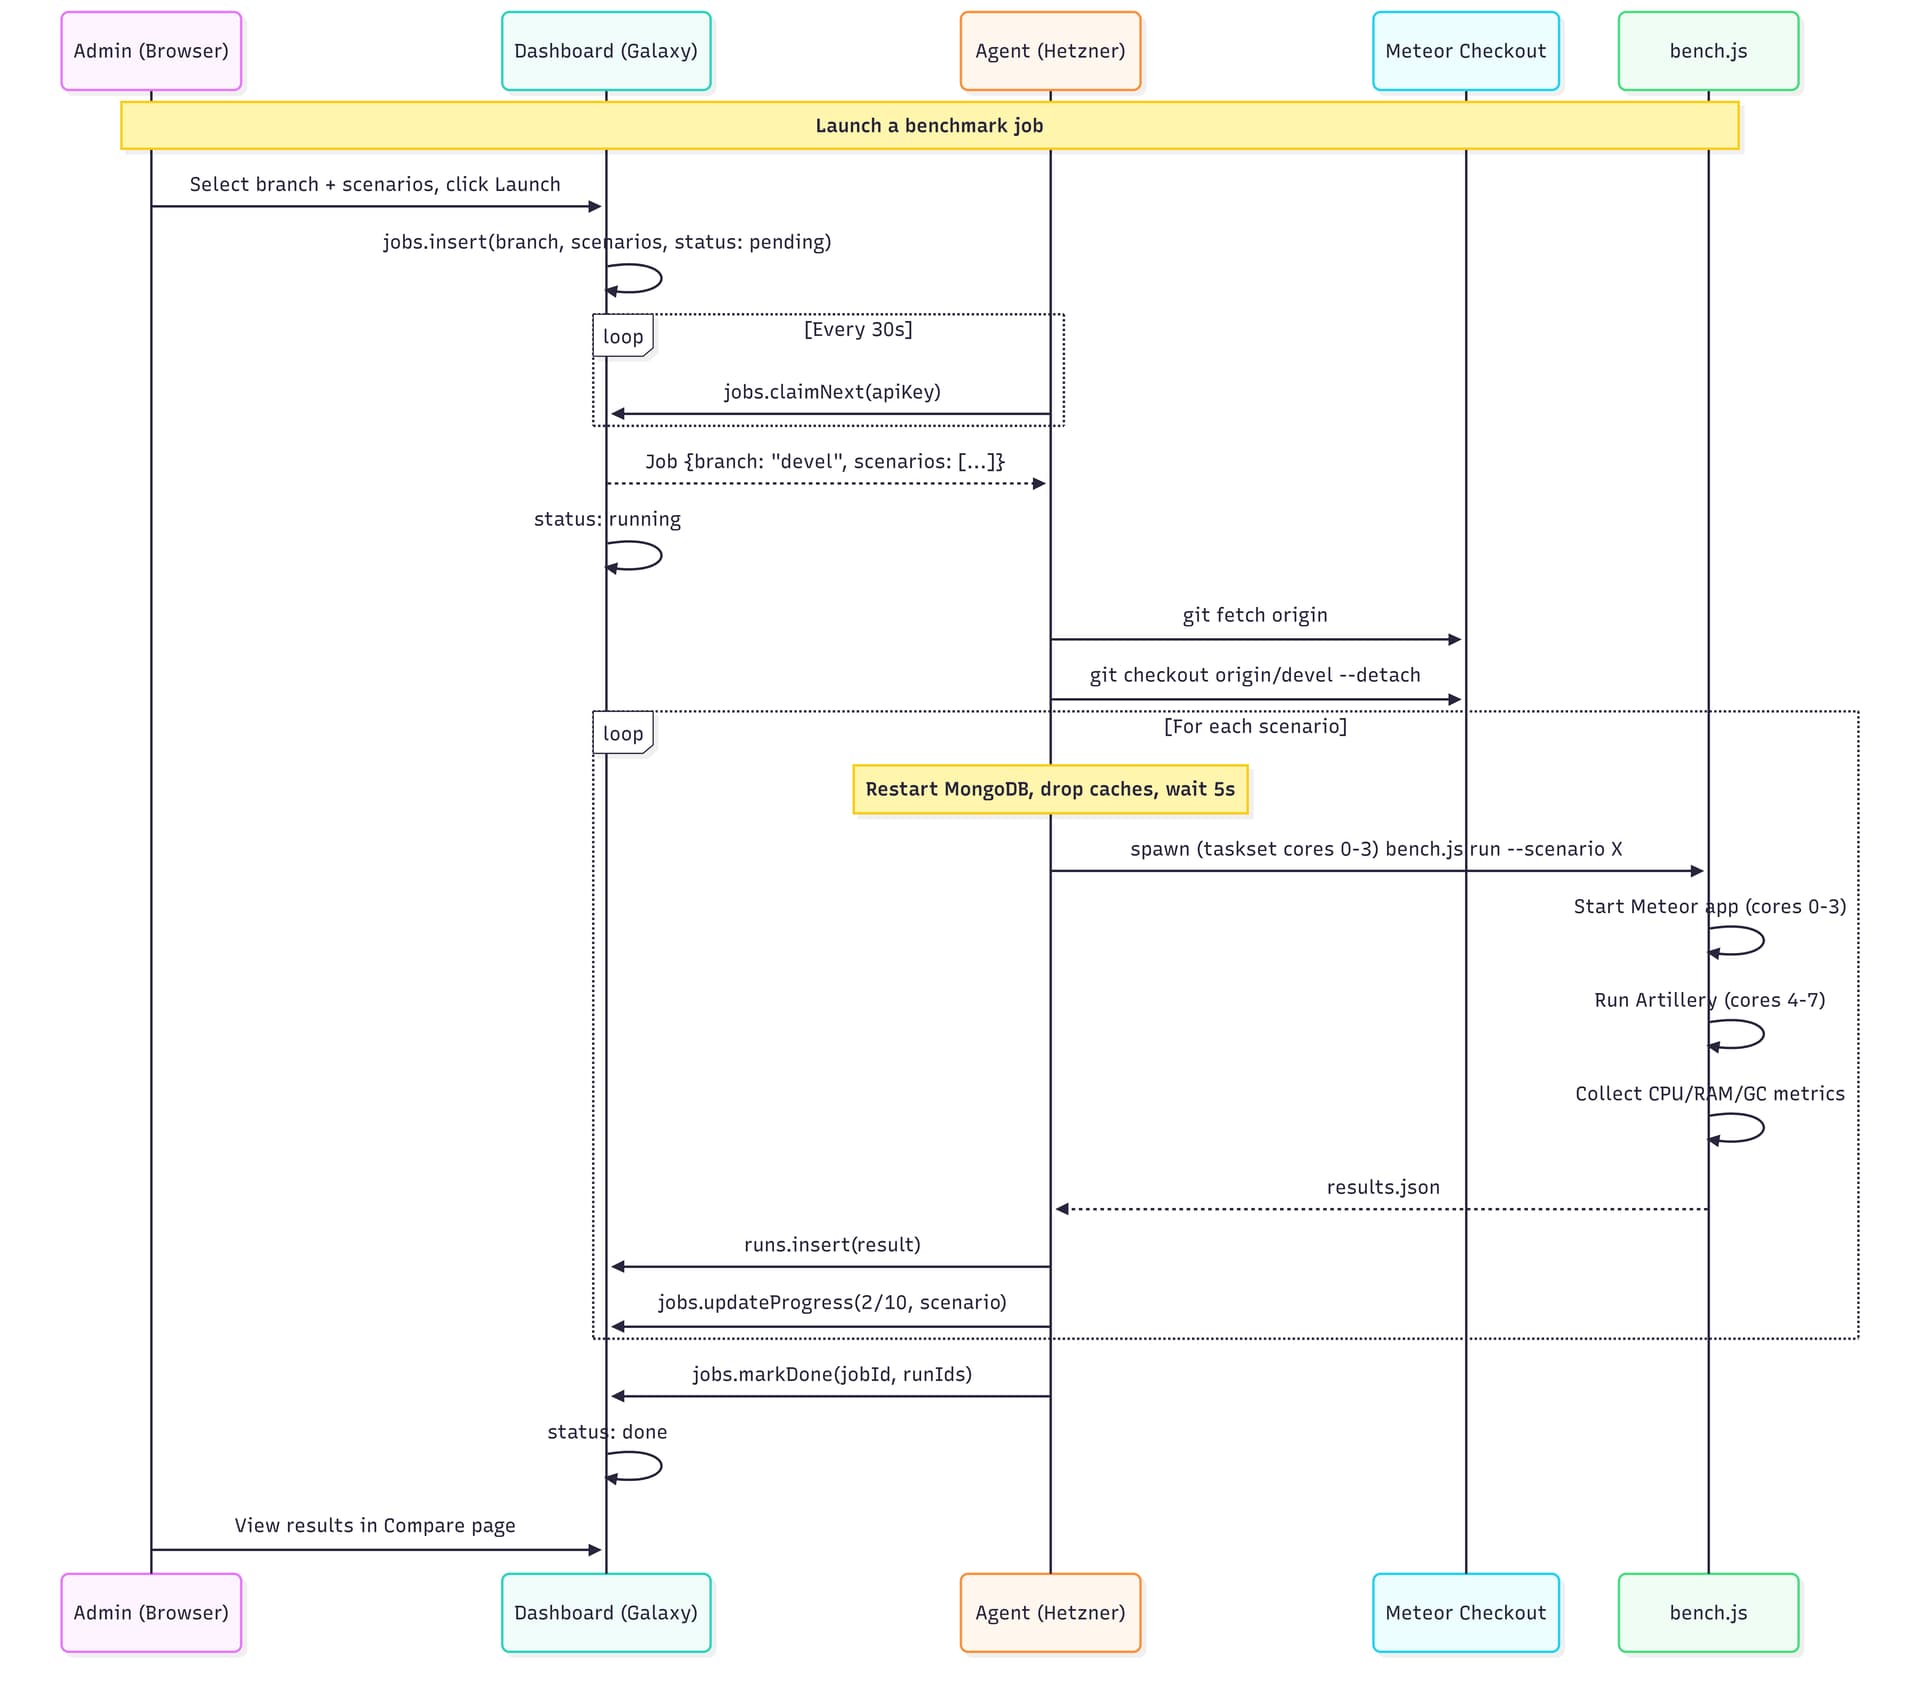
The agent polls every 30s, picks up pending jobs, runs them sequentially, and pushes results back. There’s an admin page where you can select a branch from a dropdown (synced from the Meteor repo — all 1,900+ branches), pick scenarios, and hit launch.
Dashboard updates
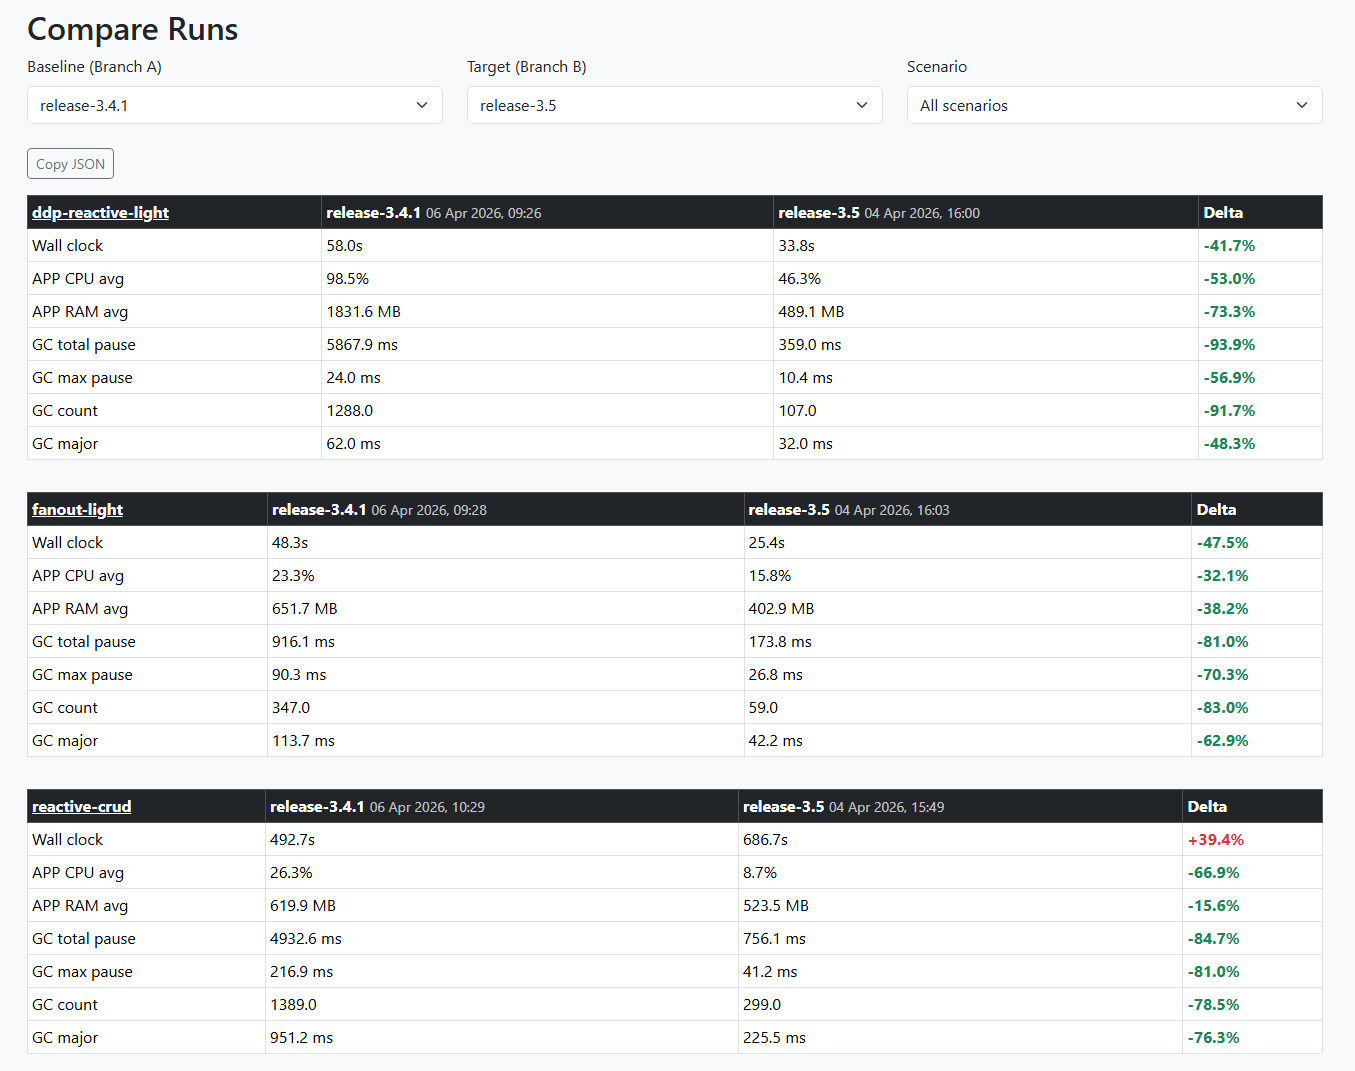
- Compare page now shows all scenarios side by side with the run date in the header, so you can see if you’re comparing runs from the same day
- Scenario names are clickable in the compare view
- Tooltips on each metric explaining what it measures
- Copy JSON button for easy data export
- About page rewritten with full methodology — CPU pinning, isolation steps, server specs
- Agent status visible in the admin panel (Online/Idle/Offline)
- Job progress in real-time (3/10 reactive-light, etc.)
First real comparison: devel vs release-3.5
All 10 scenarios, 240 concurrent Chromium sessions on the heavy ones. Same machine, same day, full isolation between scenarios.
The headline: release-3.5 has dramatically better GC.
| Scenario | Metric | devel | release-3.5 | Delta |
|---|---|---|---|---|
| reactive-crud (240 browsers) | GC total pause | 4,813 ms | 756 ms | -84% |
| reactive-crud | GC count | 970 | 299 | -69% |
| reactive-crud | Wall clock | 927s | 687s | -26% |
| non-reactive-crud (240 browsers) | GC total pause | 26,929 ms | 5,914 ms | -78% |
| non-reactive-crud | Wall clock | 373s | 267s | -28% |
| ddp-reactive-light (150 DDP) | GC count | 653 | 107 | -84% |
| ddp-reactive-light | RAM avg | 371 MB | 489 MB | +32% |
release-3.5 does 3-5x fewer garbage collections and spends 67-84% less time paused in GC. The trade-off is ~30% more RAM usage — it keeps objects alive longer instead of constantly allocating and collecting. For users, this means fewer micro-freezes and more consistent response times.
The exception — cold start:
| Scenario | devel | release-3.5 |
|---|---|---|
| cold-start | 16s | 36s |
| server bundle | 91 MB | 207 MB |
devel cold-starts in half the time. The server bundle is also half the size. Worth investigating what changed there.
What’s next
- Environment flags — compare sockjs vs uws transport, DISABLE_SOCKJS, etc.
- MongoDB-focused scenarios — read-heavy (100K docs), bulk writes, aggregation pipelines
- Split cold-start into build time vs boot time
The dashboard is public and read-only: https://meteor-benchmark-dashboard.sandbox.galaxycloud.app
Go to Compare, select devel vs release-3.5, and browse all 10 scenarios. The About page has the full methodology if you’re curious about how things are measured.
Would love feedback on what other comparisons would be useful!
3 Likes
thas is really fantastic!
3 Likes
3.4 is the current production version. So 3.5 should not introduce performance regression.
Can we compare 3.4 vs 3.5 ?
Yes, huge diff between this two! ![]() But I made some changes on the server between the 2 runs so I’m restarting the 3.5 scenarios to be sure
But I made some changes on the server between the 2 runs so I’m restarting the 3.5 scenarios to be sure ![]()
4 Likes