I’m also interested Max, even if my app ain’t got to that level yet, but it’s good to be prepared. Let’s have that chat we planned on.
This one looks very much like a query/index optimization issue. Of course the topic of performance is much wider, yet this specific case would be mitigated by indexes, it seems. And on top of that, there might be some query/schema optimizations specific to the exact use case.
Aha, this might be fitting https://github.com/queso/mongo-explainer/ to analyze your slow queries.
You can probably write an entire book about performance optimization in Meteor.
I am also facing the same issue. My database is growing day by day, my Meteor Application gets slower and slower by time, sometimes I have to kill the Meteor process and restart again. After that it runs quite better but again after some time its gets slower as the time spends.
Yes glad someone brings this up, ideally you want to use memcache to store your database results in https://github.com/Q42/meteor-memcached
In general I optimized a lot on database queries. There is also the good old
https://github.com/kadirahq/subs-manager
which helps reducing queries in general. I still use this. For newer versions of Meteor with angular or something this might not work. Also getting reactivity to 0 for queries you do not need it (Data tables or such).
I found overall if your memory increases steadily this is a leak and has nothing to do with Meteor.
Memory consumption is high depending on users connected and data retrieving on a live basis.
Indexes! Smart querying! Routing with queries (Only a subset of data per page). Unsubscribe not needed data and use something like subs-manager.
This is all very application depending though.
seems that only runs in dev mode, so doesn’t really compete with either Kadira or mLab’s profiler tools.
Hi,
I’ve been optimizing my app by improving the indexes for each type of query. I’ve followed this guide from josh owens (pretty old article but the video in his post has been updated in 2016 ). He explains pretty well how to read the query explain and how to optimize it.
He suggests to use robomongo but I used mongoclient (developed with meteor by the way)
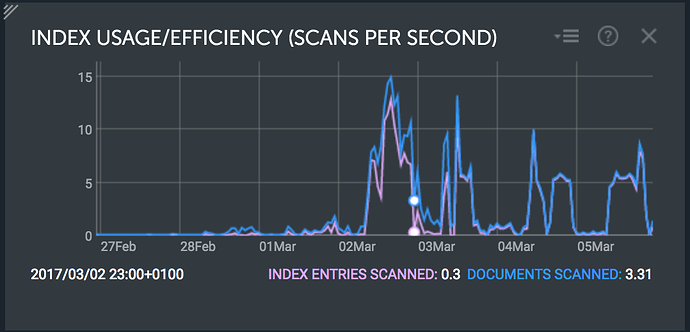
I could get my indexes scans very close to my documents scans, see on the picture below. The optimization has been done on the 3rd of march as you might notice. (Of course, we are not talking about the same amount of query…)
Hope this helps, looking forward to reading more about this performance guide!
Thanks! Part of my issue is that we have some regex queries which search across multiple text fields, so we may need to implement full-text search indexes on those fields (or perhaps reimplement these search features with something like Elasticsearch).
Also we are using auth0.com and I see that some regex queries coming from them (presumably when we search for users in their web UI) are very punishing.
I would definitely recommend starting with mongo full-text search first, it’s already pretty efficient and so much simpler to implement.
I’ve spent (wasted?) a lot of time trying to work with Elasticsearch and I might come back to it in the future but it requires a full dedication to set it up properly and maintain it + additional server costs. I’m not (yet) an expert in Elasticsearch nor mongo but surely mongo fts gives already a very good tool to start. If you reach the limitations then, of course, try to switch to ES. I’m using mongo fts with easysearch package and it also has a search engine for elasticsearch if you then want to switch to this solution.
In terms of performance you can check at the bottom of this article MongoDB vs. Elasticsearch: The Quest of the Holy Performances. It might be a bit outdated but still gives good insights. It compares performance in general, not FTS specifically.
I have some other articles that I could forward you but I don’t think it’s the right place to flood with articles about ES and Mongo FTS comparison. There’s probably already a topic in this forum actually 
I have a use-case where I have thousands of users all calling the same Meteor Method at once that queries Mongo. I’m getting really long fetch times from Mongo in Meteor APM - like 40,000ms. I’ve disabled Oplog as a test and it still happens.
I’m using Compose’s MongoDB Classic which uses Mongo 2.6 (I think). So it is old and doesn’t have advanced features.
Anyone have any advice for raw Mongo improvement? I notice both Compose and Atlas offer versions of Mongo that offer scaling, nodes, and shards. Will this help?
I’m noticing that if I test with 1000 users simultaneously my database wait time is 10,000ms and if I test with 2000 users simultaneously my database wait time is 20,000ms. So it leads me to believe it may just be raw Mongo compression. I have keys set and all the other above optimizations.
I’m now just dealing with A LOT of simultaneous users.
@evolross you have several ways to tackle the problem.
First, from the information you provided, it’s clear that the database is a bottleneck, 2000 requests/s may be too heavy for it.
How about this, try creating a mongo database within the same network, make sure to apply propper indexes. My guess is that your performance will increase dramatically.
Next step is to think about caching your queries. (Grapher already offers some nice tricks for that, even if you do not use Grapher Queries, you can use Resolver Named Queries and benefit of painless caching)
How many instances did you have for 2000 users ? In my opinion Meteor handles correctly around 350~ sessions.
Do you really need websocket open and reactivity ? Do you need it everywhere ? We’ve built https://github.com/cult-of-coders/fusion to help us in that regard, where we open the websocket on some pages only.
Algolia is really great for this type of thing.
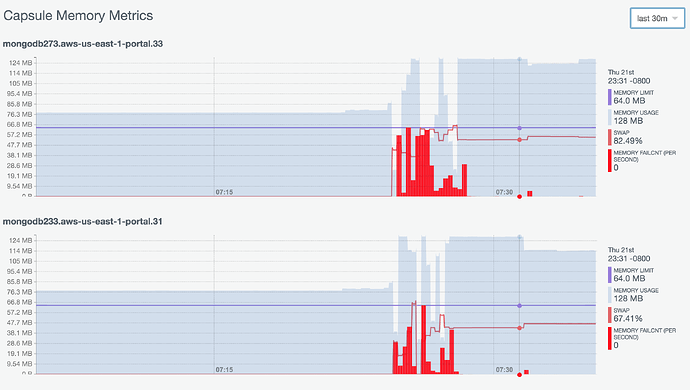
I switched my database over to Compose’s full-featured Mongo which uses MongoDB 3.2.11 with WiredTiger. Imported my data and did a test. Still bottlenecked. But I had the following metrics:
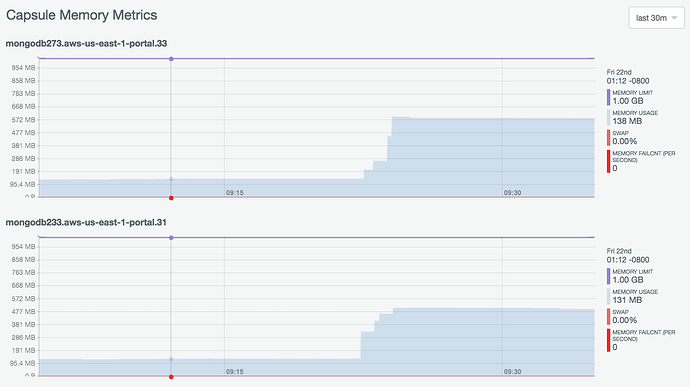
So obviously in Compose, I needed more RAM on my “routers” because I was hitting the default of 64MB and getting lots of memory faults and tons of swap usage. So I upped them to 128MB. Wasn’t enough. Then to 512MB. Wasn’t enough. Finally at 1GB I had enough head room (notice the blue memory usage spiking but not reaching the purple memory limit):
Problem is, it’s better, but it’s still not great. Still getting 15s wait times on the database (versus 40s before)… I was thinking maybe it was my app and I needed to unblock something, but if it were an unblock issue, wouldn’t that manifest itself as “wait time” in Meteor APM? Going to try to vastly reduce how much database calls my methods make and also try Atlas really cranked up and see if I can get anywhere.
@diaconutheodor I’m not sure how to make a MongoDB on the “same network”. I’m using Galaxy for my servers. It’s on AWS Northern Virginia (I think) and so is my Compose deployment, so that should be optimal right? The above tests were for 4000 simultaneous users all calling the same “participation” Meteor Method near the same time. For 4000 users I’m testing with 12 Galaxy Quad containers. They seem to be fine. Each one handles about ~333 users just fine. No CPU spikes, definitely no memory problems. CPU gets to about 70% on each container. So I think it’s the DB… trying to figure out how to crank Mongo and/or greatly optimize how many fetches my Meteor Methods are doing. The problem is I have to fetch a lot of stuff in order “check” if the insert the user is trying to do is allowed. I think a lot of those fetches are slowing things down. Going to do some more testing.
The interesting thing is my app works great on a test with about 400 simultaneous users, using one Galaxy Quad container… even 500 to 750 users. Super quick response and database times. Like under 1 or 2 secs for every test agent. So that leads me to believe that my indexes and app are good. It just breaks under extreme amounts of users all trying to hit the same database…
Hi community! Any news on the guide idea?
Do you have any best practices/recommendations on how to measure the overall performance and detecting bottlenecks ? Particularly with an Android client.
Kadira is so helpful and informative in this regard, simply understanding how it works and what the significance of its messaging is will solve the vast majority of performance issues. @arunoda truly made one of the best APMs in the web ecosystem. It’s a real gem.
You should also familiarize yourself with the Chrome profiler for Android on a common midrange device like the Samsung J7. While there are a lot of ways to screw up basic things in meteor, your client-side code is typically the bottleneck. After all, you can always pay for a faster server, but you can rarely mail your users faster phones.
Meteor is not an opaque technology, it’s a transparent collection of old ideas, like fibers and RPC over websockets. It’s slowest algorithms are O(n log n) for diffing lists. Phone technology, particularly parsing and compiling Javascript, has still not fully caught up with meteor, so you’ll get the biggest payoff from a guide about Android Browser optimization than meteor optimization.
hey btw if you guys need help with performance issues these guys are good:
@eluck and his consulting services team helped identify and fix some rogue publications that there causing occasional crashes that were driving us nuts.
UPDATE
We re-engineering our app to Hasura and finally pulled the plug on Meteor/Galaxy today.
How did it go Max? I didn’t know Hasura but see it’s graphql. Happy with the result?


