Kadira has a nice CPU profiler which you can use to help debug things like this
https://kadira.io/academy/meteor-performance-101/content/meteor-cpu-profiling
Try deleting Meteor and reinstalling it. We’ve seen this issue happen occasionally and this has solved it.
Everything went back to normal 
Well not really sure what was wrong, I’m investigating deeper on what could have been wrong.
1 Like
Some things to check:
- check your publications, do you use a lot of publish-composite or similar? Do they often invalidate?
- do you publish huge amounts of data that are not indexed? --> add good indexes to your collections
- do you have hooks on your collection or use collection.observe on the server that invoke “expensive” computations? (aggregation or so)
- what is the state of the memory? is it full? --> maybe a leak. Full memory can also lead to high-cpu usage
- maybe also list the packages that you are using
2 Likes
Don’t know if this will help you, but I had something similar at Digital Ocean. My website crashed every 2.5 days with a CPU going over 100%. No errors, no apparent reason. In the end I tried a more expensive package, with more RAM. So far, so good, the problem did not occur for more than 4 days now.
1 Like
Exact the same issue here!
I have 8gb of RAM  , but are you sure that’s the solution? I’m afraid that It might bite you back in the future
1 Like
Thanks! I will have a look into it I will keep this post updated…
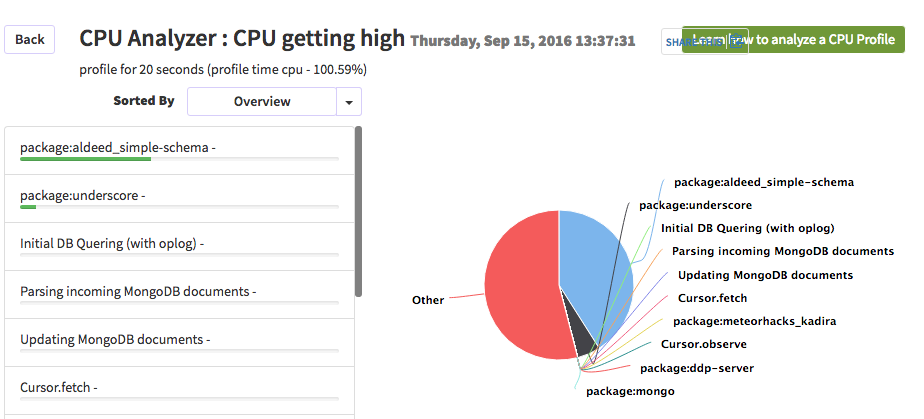
I’ve profiled the CPU with Kadira and I think my problem probably could be related to aldeed:simple-schema

Stay tuned :'D
I don’t know for sure. So far so good. I kind of regret my decision to do it in Meteor anyway and I am tired of finding solutions for all kinds of problems. The 1(!)Gb package that I have right now can be cancelled at any time, so as soon as I get the same problem, I ditch it. I feel your pain! Good luck man.
1 Like
Yikes, if aldeed:simple-schema is causing those problems, I’m screwed. I use that for my application.
1 Like
What version of Meteor are you using?
I’m having the same problem. No users and CPU use staying at 99%. I’m running Meteor 1.4.1.1 on node 4.5.0. I have plenty of ram free and have tried rebooting.
This is only happening on the server. My local dev version doesn’t break above about 14% even with use.
Here we are running Meteor 1.2.1 with node v0.10.40.
Exactly the same issue, happening only on production environment.
If it can help, even after restarting meteor/phisically restarting the server the process goes automatically to 100%.
The same if I build up a new instace on aws with the same settings/db.
Here is what happened to me last times…
Meteor works normally, at one point the CPU goes crazy for hours and after a huge downtime the cpu from 100% goes down by 0.1% per second until reaching 6% (My normal usage)
Edit: More informations
You guys really need to take some CPU profiles on your production server when it is exhibiting the issue; if it’s stuck at 100% CPU and you profile it, it should give a pretty clear indication as to what’s causing it.
So I’ve done some experimenting. In my mongo database I had ~38,000 records. When I remove all but 600 of them it becomes nice and snappy again and CPU usage drops to 1-2%.
Note the maximum number of records ever subscribed to was about 200. The high CPU usage occurs even if the app has never been visited by a browser which seems bizarre.
And again, it’s working fine locally with an identical dataset.
You guys should know your application and how you use certain packages.
SimpleSchema is usually used to validate forms on the client, to validate method-calls (if you use mdg:validated-method) or to validate collection-inserts and updates with aldeed:collection2.
If simpleSchema pops up in your server-side-cpu-profile, this means that you do either a lot of validated method-calls and/or a lot of database-updates / inserts.
Then, verfiy if this is normal for your app (an app with lots of users and lots of write-operations) or if it is a client-side bug (clients invoke too much method-calls).
Also check if you have server-side-db-hooks or similar that do db-writes periodically
2 Likes
I’ve been profiling the CPU and sometimes it’s hard to profile it because Kadira just doesn’t get the resources.
But so far I’ve been lucky and I’ve got the the profile of the CPU when it was 100%. The package aldeed:simple-schema seems that was using a lot of CPU (screenshot)
Perhaps is as @macrozone says that we are using simple-schema wrong… ̶̶I̶ ̶t̶h̶i̶n̶k̶ ̶w̶e̶ ̶a̶r̶e̶ ̶n̶o̶t̶ ̶u̶s̶i̶n̶g̶ ̶a̶l̶d̶e̶e̶d̶:̶c̶o̶l̶l̶e̶c̶t̶i̶o̶n̶2̶
(No server-side-db hooks here, probably)
Can you not drill-down more into what’s using all the CPU within that package?
I am not stating, that you are using it wrong. I am stating, that it is maybe just a symptom, not the reason for your performance-problem. 
1 Like