With a very recent release of ours, we now encounter a VERY strange behavior of Meteor we have never seen before.
Since these changes by us, the performance of our app is suddenly not deterministic anymore!
Meaning: We deploy our branch with our changes to our server to one of our docker containers - the response times are fine! Now, if we deploy exactly the same changes to one of our other docker containers, OR we docker restart the existing container that was just quick moments ago, the response times suddenly tank and we are over twice or almost 3x slower.
We are completely out of ideas - we make NO changes to our setup, and the whole response times (and in turn the CPU load on our server!) behave all over the place.
Does anyone have any ideas on this? We can really validate this with our monti setup, that the simple docker restart made everything slower over 2x.
We are running this on our testing server, so there are NO sideeffects, no random users accessing it, … we basically “keep all variables stable” as best as we can!
One more thing:
The server is THAT busy during these times, that even serving a simple 3KB svg file from our server can take up to 1.6 seconds. So we had to completely revert these changes on production, because we could not handle our usual load anymore - the CPU spikes on our node processes just went crazy!
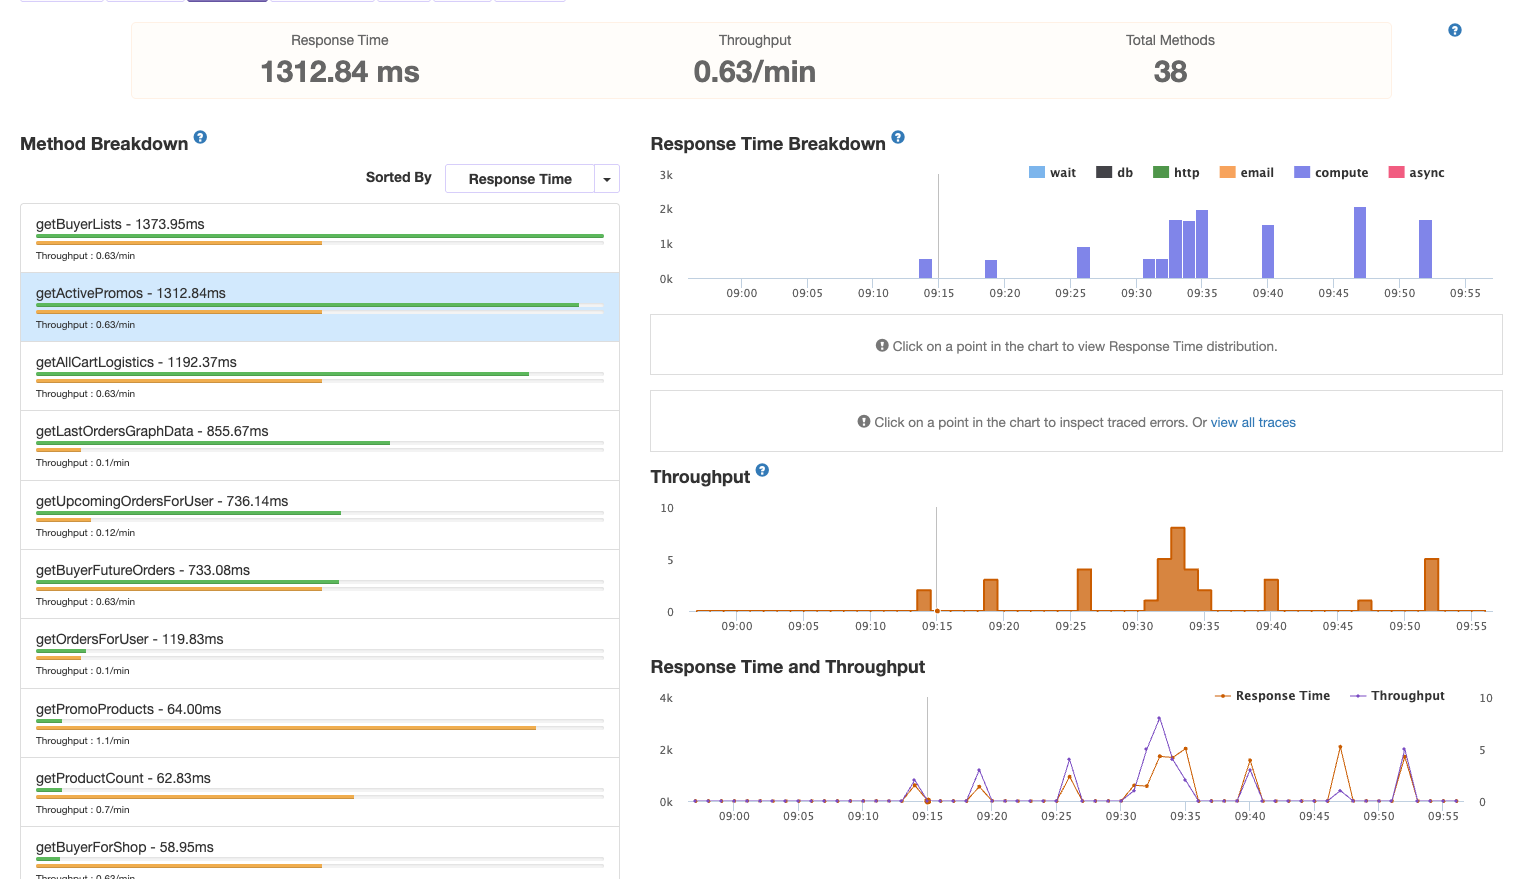
EDIT: You can even see here the crazy compute time for our methods in monti:
No, the total number of docker containers is stable.
Even if I spin up only one container and then do a restart, the performance seemingly totally changes.
Again, we have no idea what is going on!
The changes in question are almost only clientside, we already debugged all method calls and stuff and the number of these calls did not change - so we are completely out of ideas what causes these CPU spikes slowing everything down!
Sidenote: both our production server and our staging servers are affected by this.
So we just do not understand what seems to be happening in the background here of some sort, that causes the CPU issues.
important: The CPU spikes are always triggered by a user! In other words - just keeping the server running, the CPU is just fine, so nothing just happens in the background.
Whenever a user accesses the page, we see these huge spikes and also the loading times are twice as bad - so it definitely is triggered by the page view, whatever it is.
We removed a huge clientside library (antd) → our main .js client package is now much smaller, it should load faster.
Due to this, maybe, some methods can be called in a quicker succession (because basically all of our methods use this.unblock() - does this even still exist now with Promises? we use Meteor 3.2!)
this, in turn, leads to a higher load on the server, although the amount of data remains the same, because the methods are “called quicker”.
We have now been on this topic for 5 business days with 3+ developers, and we can’t think of anything else anymore … We are really desperate at this point!
Have you tested rolling back to a version where this is not happening? This can help you identify the change that might have resulted in your current issue.
@rjdavid Of course, this is exactly what we have been doing!
The old version is still “stable”, then we tried to add code changes file per file.
Then, quite randomly, it seems to get slow again.
The weirdest part remains:
When we reach branch X that contains Y changes from our “broken branch”, and this branch X works fine on our docker container, sometimes, a simple docker restart is enough to break it. This makes zero sense to me, but I promise you that this is the case!
We just restart the same container, so by definition no changes to the code, the image, the JS bundle, nothing … and suddenly the page load times double or tripple and the CPU goes crazy again.
Not really … all we can see I think is that “computation” took up to 2 seconds.
We think, this is due to just the CPU being overloaded at that time, making everything slow.
I have a Meteor 3 compatible version of Meteor Down. With this you have control over methods, calling them one by one until you eventually identify a problem.
It looks like this:
meteorDown.init(Meteor => {
  Meteor.call('getUserExtrasMethod', {}, (err, res) => { // your method
    if (err) {
      console.log(err)
    } else {
      Meteor.kill()
    }
  })
})

meteorDown.run({
  concurrency: 20, // your connurency
  key: '****', // a Meteor Down password that authenticates your user
  // url: "http://192.168.1.72:3000",
  url: 'https://www.your_live_url.com',
  auth: { userIds: ['xxxxxxx'] } // impersonate your users with the user _id
})