SUCCESS!
Thanks for the help guys! Pretty sure I just solved the Mongo problems that I was facing.
Here’s a mini blog post on the process I went through:
Quick background: I’m using Compose.io for MongoDB hosting (their MongoDB Classic package as of now). The app was being really slow at responding and I didn’t understand why. Compose.io support were suggesting I add more RAM, which I did, but that really didn’t help anything and was just costing me more money. Kadira was showing me something like this:
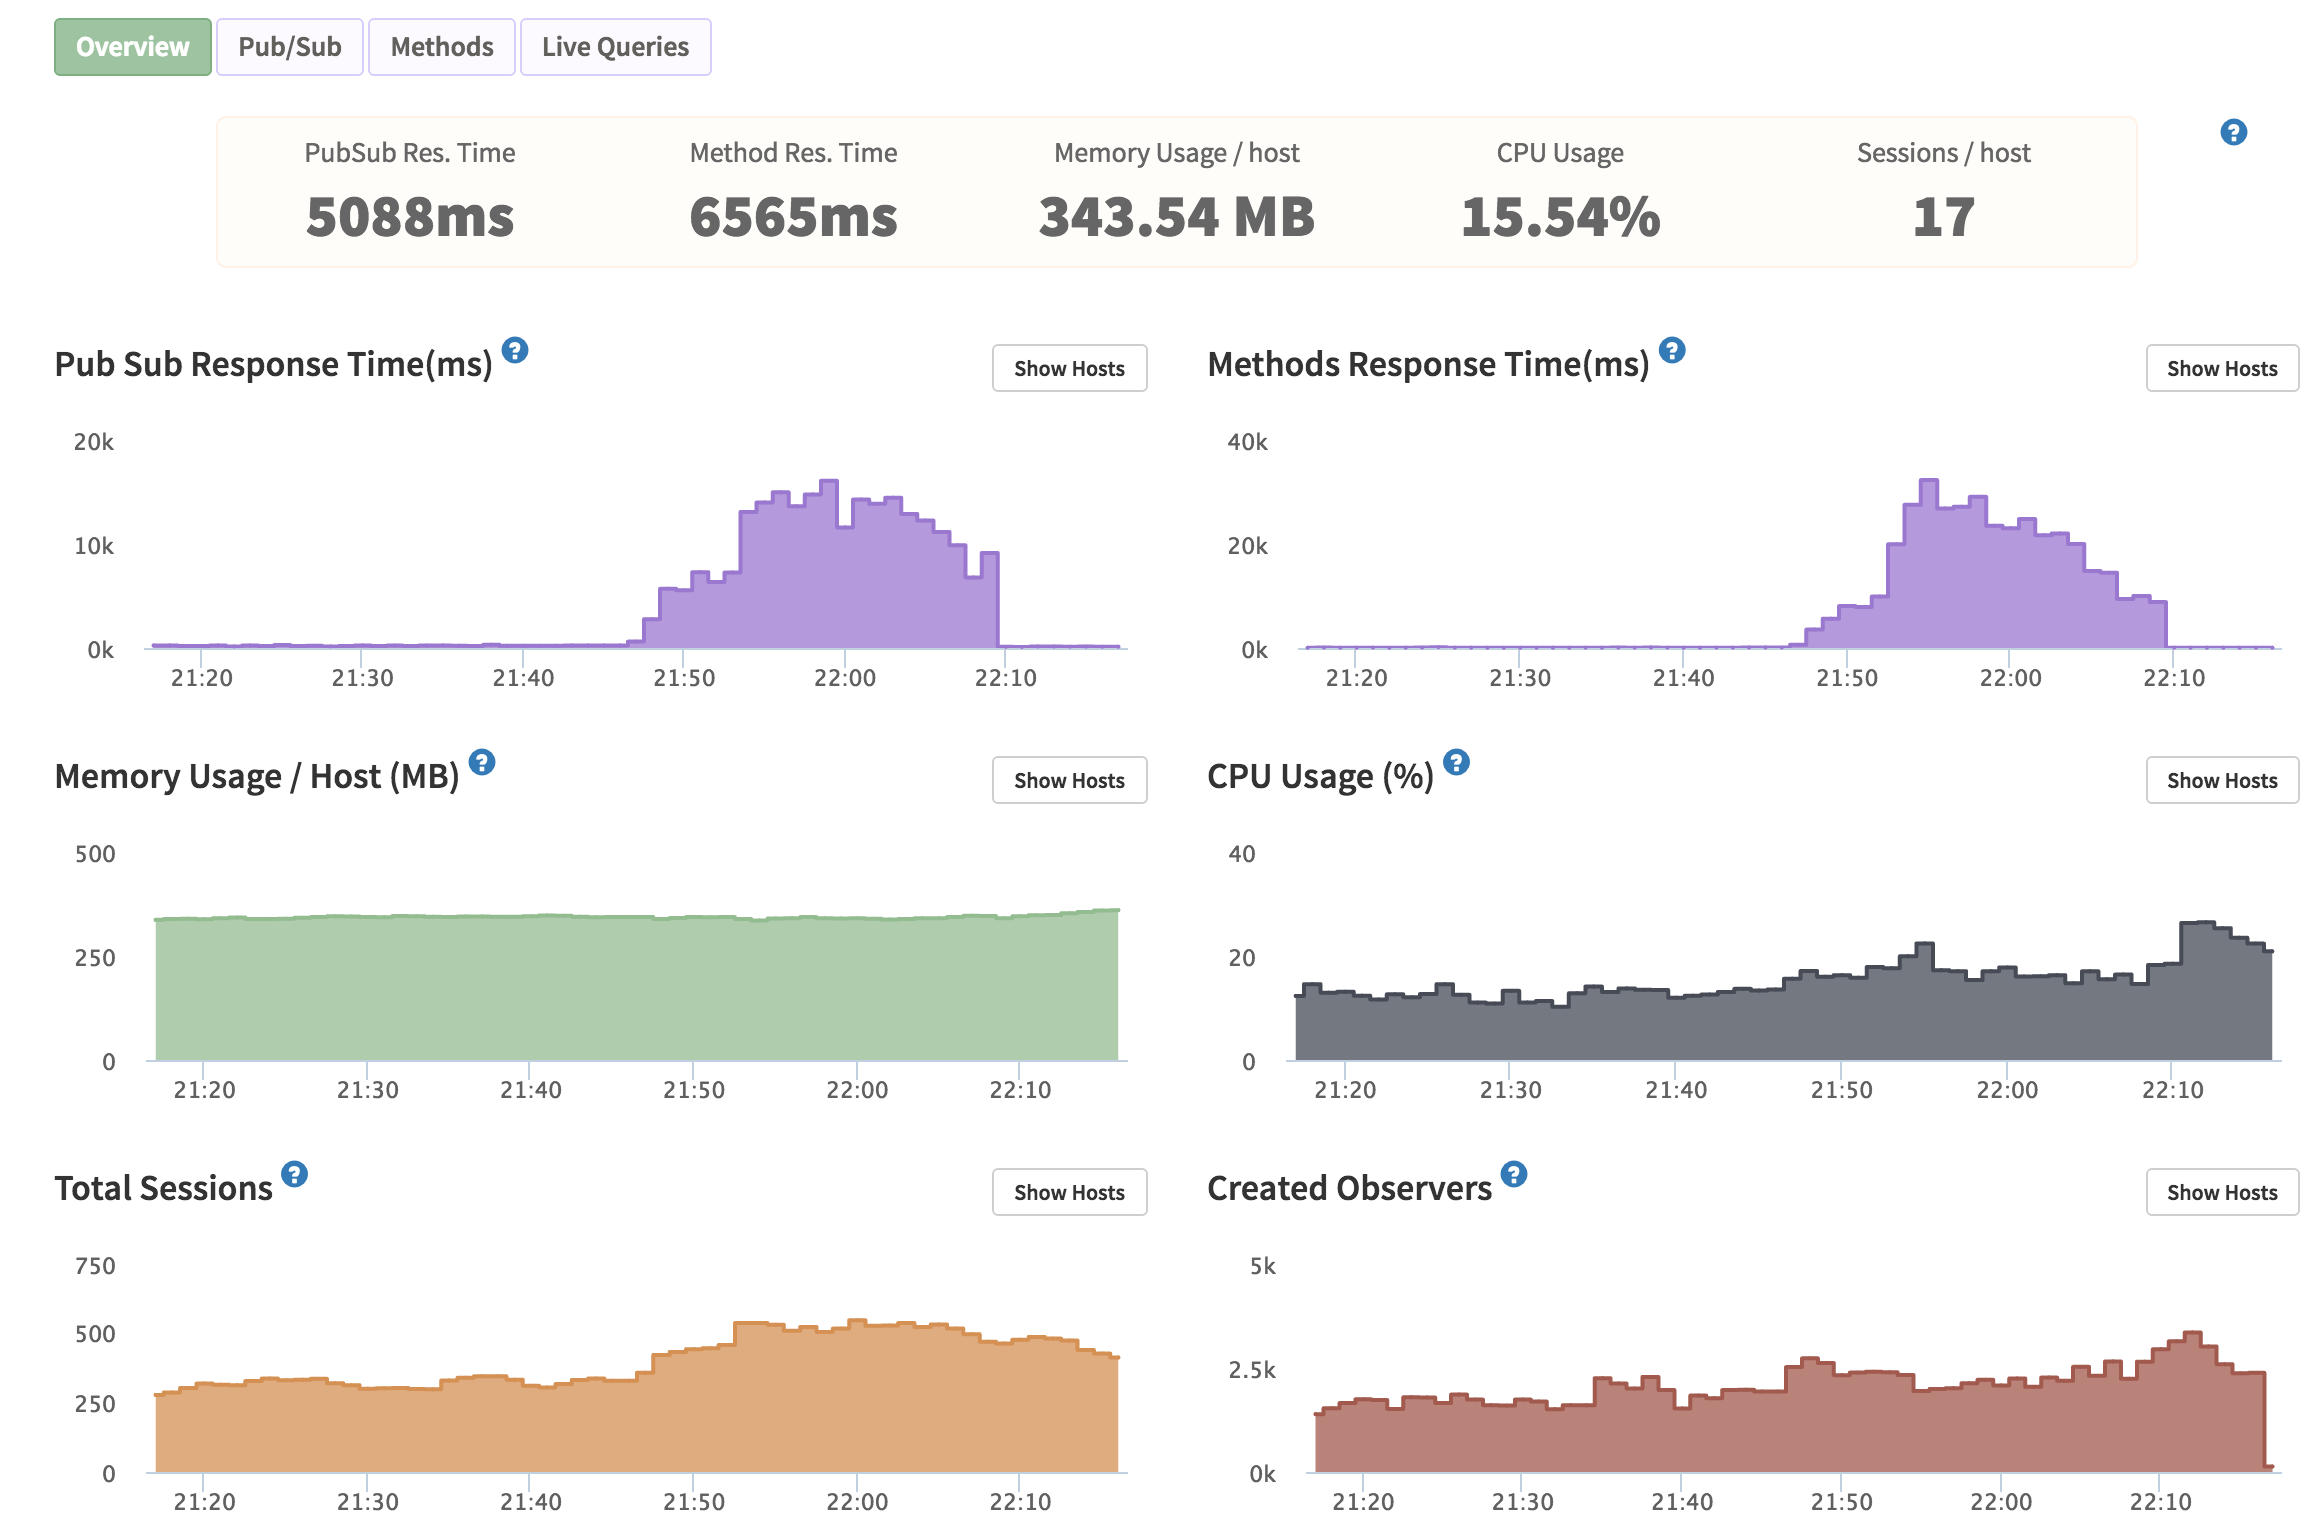
(Response time goes back to normal at around 22:08 which is when I solved the problem).
The database was taking ~30s to respond to queries during peak traffic, but I couldn’t understand why. Adding more servers didn’t help anything and actually made things worse because the DB couldn’t handle all the connections as @int64 mentioned above. (I was running 50+ Meteor instances at some points. Now it’s about 20).
Kadira helped by showing me that the method response time was slow due to Mongo taking ~30secs to respond!
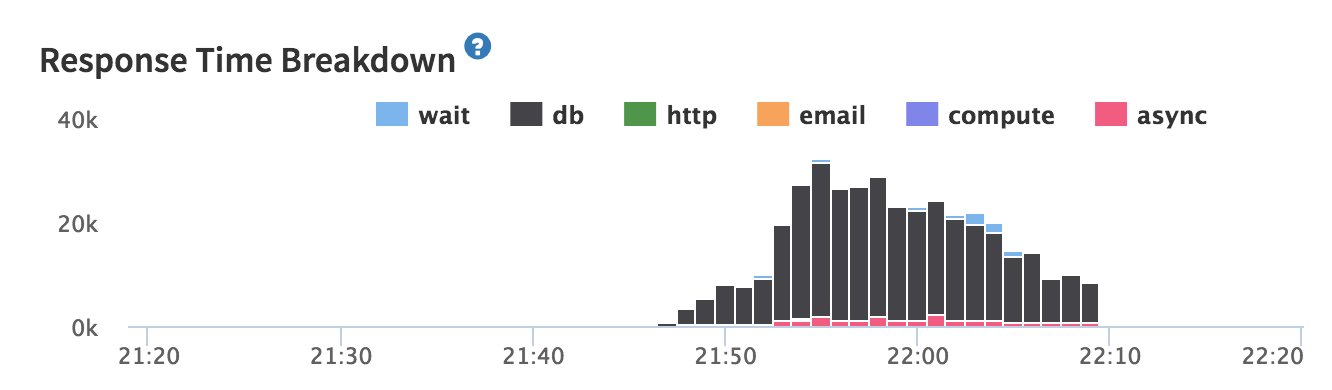
But this only helped me part of the way because all DB operations were slow. So how do I find the problem?
Ask on the forums, SO, and Compose.io support  which led me to:
During peak times I logged in to Compose.io and had a look at the current ops that were running and saw something like this (but far worse):
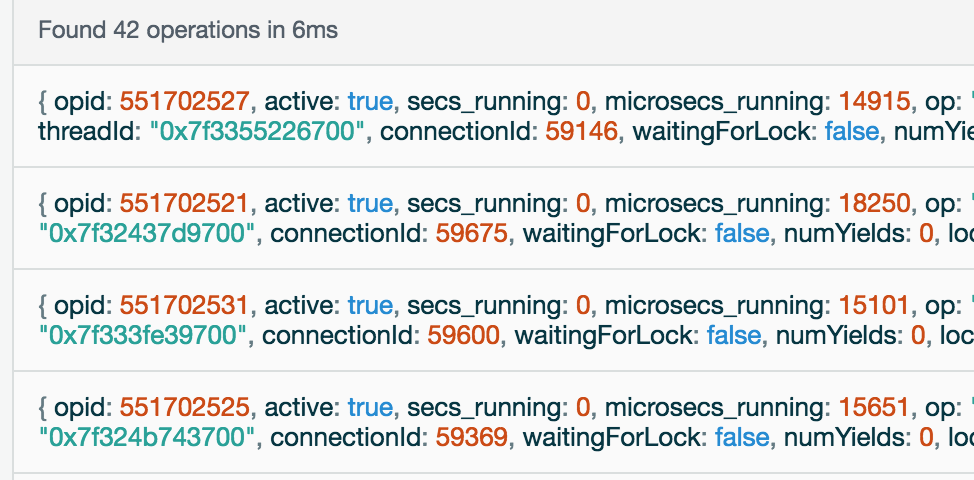
Had no idea what all this mumbo jumbo was, but you’ll see that each op has a secs_running field. In the image above it says 0 seconds for everything, which is great! But what I was seeing during peak time was 14 seconds, 9 seconds, 10 seconds… for the different operations that were going on! And it was all coming from the same query being made by my app.
I ran this query myself and it really did take something like 16 seconds to get a response! Not good! And running it with explain (as @hwillson suggested) showed that 180,000+ documents were being scanned! Here’s an example of a problematic query:

Anyway… lo and behold, there’s no index set up for such a query, so I added teamId1: 1, gameweek: 1 and teamId2: 1, gameweek: 1 as indexes and ran the query again and I get the response in milliseconds.
After this the whole database starts acting quickly again. This one problematic query was slowing down the entire database!
I use indexes for almost every publication, but this is one that I forgot to add and it wasn’t easy to find initially!
Hope this helps someone in the future. Might make it to Medium at some point. Or not
Thanks a lot for the help again!