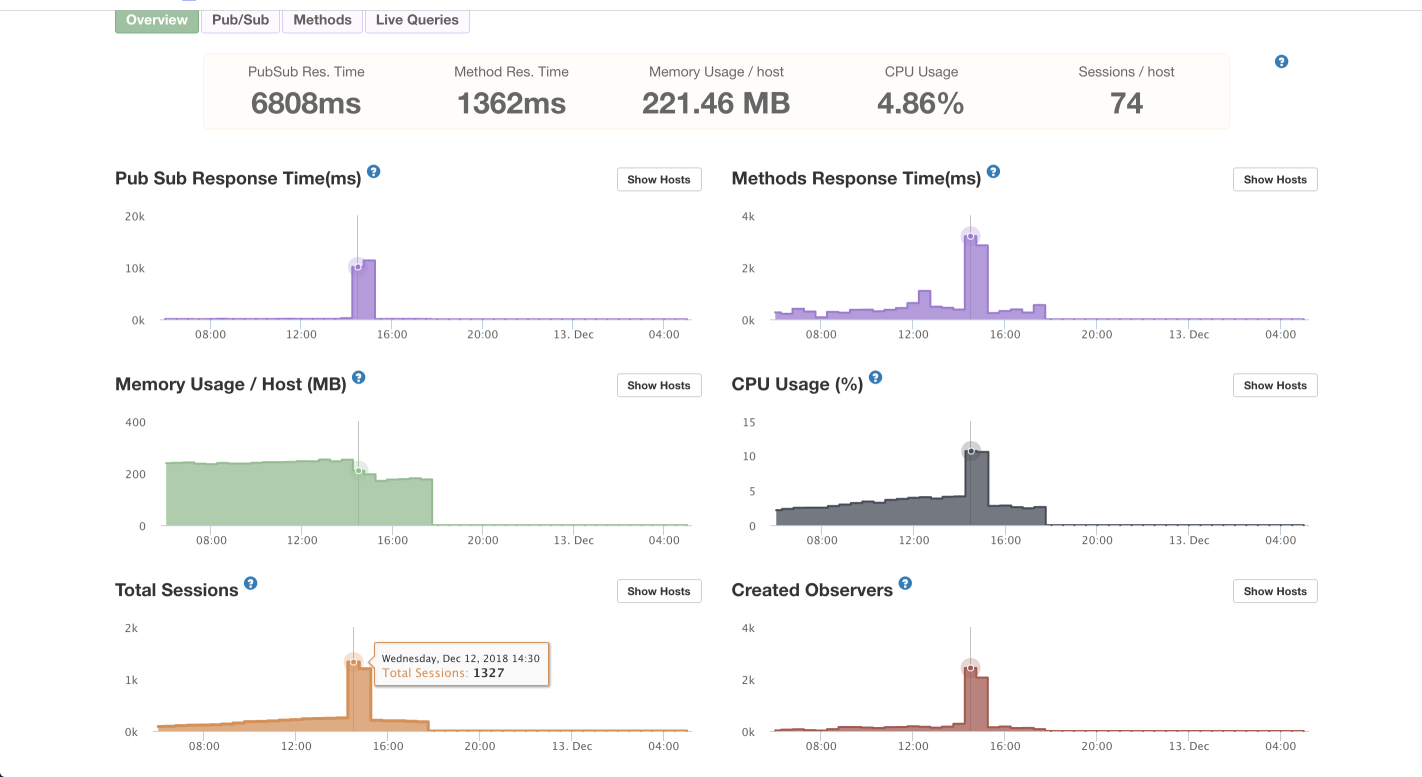
I’m hoping someone can shine some light on an issue I’m having (the screenshot below is from the second time it has happened). Scenario:
APM shows a spike in total sessions - usually it’s at around 200-300, but this spike took it to over 1200 for 30-60 minutes
There is basically no way this was a spike in actual app usage
The version of the app running on Galaxy is stable, hasn’t been updated in 6-8 weeks and this is just the second time this has happened (the one other instance about two weeks ago). I feel that if this was code related it would be an issue happening more frequently
We are running 3 of Galaxy’s smallest containers to handle our constant 200-300 sessions
The spike caused all 3 galaxy containers to repeatedly restart saying: ‘Failed health check’ - no console errors or any sort of error logs are reported
The corresponding CPU usage spike I believe is a result of the restarting servers rather than the other way round
Galaxy support say it has nothing to do with them. And I don’t think it does in this case, though in the past they have brushed of and actual issue in the same way, so I’m not 100% confident of what they say
tl;dr – clients disconnecting/reconnecting under heavy load sets up a feedback loop that crashes servers
I have realized that this may be an inherent flaw in Meteor. If the docs are correct, then anytime a client is disconnected for any reason and then reconnects the server will not resume/reuse their old publications and observers. It destroys the old ones and sets everything up from scratch again.
This means that if a server gets loaded heavily enough that some clients disconnect then they will immediately try to reconnect and upon successful reconnection load the server up even more by restarting all of their publications. It seems like this high-load feedback loop is built into the core of meteor and grows in severity with the per-user complexity of the app.
I’m running into this problem. My app is complex and uses a bunch of publications per user. It can handle lots of users at once with no problem as long as they don’t all connect at the same time. Each user connecting and setting up its publications uses a ton of resources. This causes a problem on deployments or server crashes as there is a big spike in load as everybody reconnects. The resource usage when setting up publications is so high that users get disconnected then reconnect resulting in the feedback loop I’m describing. The only way I have around this at the moment is to vastly over-provision capacity per user just to handle the initial resource spike upon first connection. If an instance survives the spike then it hums along happily using ~10-20% of its capacity. I am potentially over provisioning by a factor of 10 just to get around this!
So you’ve a CPU spike due to a spike in sessions which is normal. I’m actually surprised that the CPU spike didn’t exceed the 10% I think that spike immediately crushed the container so APM didn’t even register the actual numbers. But I don’t understand how it says it was able handle the load for 30 minute, under such load I think it should have just crushed with seconds.
I’ve done some extensive performance testing, and yes you can easily crush Meteor/NodeJS containers with CPU spikes, you’ve 1k sessions triggered instantaneously which could either exhaust the memory, CPU or cause bottleneck at the DB connection all of which would crush the server.
That’s all understandable if that was the case (i.e. - that the app did have 1k sessions in a short span of time).
But I am fairly certain that that is not the case - the app simply does not have enough users for this kind of spike. The only way that number is accurate (or if APM didn’t register all the numbers then the number is less than the actual) is if the sessions were the result of a bot or malicious script.
So the question I have is what would cause this kind of behaviour outside of a bot/malicious script starting sessions - if that is the only explanation then I can take steps to find out the specifics and see how that can be prevented. If other explanations are possible then I need to evaluate all of them and figure out what is going on.
Ah I see, so you’re not sure what caused the spike in the first place and you’re wondering if it’s actual external requests or something internal that’s not working properly.
I’ve not encountered an issue where sessions are randomly created by the server or false records, sounds unlikely to me. But with that said, it’s actually very hard/expensive to simulate 1k socket logged-in users via bots. In our setup we’ve load balancer up front so we can analyze the incoming requests and conclude whether it’s internal or external but I guess the issue you’re having is the lack of visible on the external domain hits.
That’s exactly it (and better, more concisely worded than my original question - thanks for that).
May I ask what your setup is? (Load balancing for my intents and purposes is handles - quite well - by Galaxy).
…whether it’s internal or external but I guess the issue you’re having is the lack of visible on the external domain hits.
Hmm. I wonder whether Galaxy has support for this or whether methods/publications can be set up to prevent any external requests. The majority of them already do use a this.userId check - but many simultaneous such requests could still bring down a server regardless.
Yet again I wish Galaxy had alerts and auto-scaling…
So you’re suspecting that methods are being called externally directly?
I’m not sure how Kadira APM is counting those sessions but from what I observed it’s tracks logged in users. If that is true and the session count is accurate, then those 1k are actually authenticated sessions. I’m personally out of my depth here, I’ve only simulated users logins and observed performance not sure about external methods calls.
I can only add that my inclination is that it’s actually external requests given I’ve not observed random internal spikes like this on my end.
I’ll report back here if I find anything - for now I’ve added an extra container to see if that has any effect (shooting blind here). I’ll also set up redis-oplog.
Maybe it’d help if you could somehow log the source of the request we do that in the SSR at the server, but again I’m not sure how your methods/pages are being called.
In my experience this is a problem. Galaxy’s 0.5 ECU container is equivalent to like a 200MHz CPU… 200 MHz! This like running your app with a server from 1998. It’s very easy to overload. And I’ve noticed when you overload Galaxy containers, APM stats can go wonky. But I’ve never seen my sessions surge like that… usually it’s 10% - 15% off.
Not sure if it could be a malicious script… kinda looks like it though. Why don’t you try bumping up your containers and see if it continues.
My app has two different servers - we run 3 Standard (1 ECU each) and 3 Double (2 ECU each). The 3 Doubles handle thousands of connections a the same time. The Compact container is only for testing IMO.
Cheers for the 2c - all taken into account. Yeah fair point on the computing power of a compact - going by Galaxy’s guide though, it pointed towards favouring horizontal scaling vs vertical and that’s the approach I took.
I suppose there is something to be said for having a minimum standard container before applying such a rule though.
An update for anyone on this thread (not much to report but regardless):
I’ve been monitoring things (without changing anything) - the issue hasn’t happened again or come close to happening again
I should have redis oplog up soon, in case that is in fact a factor in all this
I’ve started experimenting with Waves Hosting (with a separate project) - I’ll do a more in depth review soon but it’s showing a tonne of promise and I’ve been very impressed. Way more raw computer power, auto scaling, fraction of Galaxy’s cost (and most/all the features that Galaxy has - at least the ones I use/value). @nicolaslopezj is also really active, responsive and helpful. Pretty sure I will transition everything over to it once I am comfortable of doing so with a production app. Main point here is that the autoscaling will, in theory, prevent such an issue from happening again (whatever the cause).
tl;dr - Still unsure of root cause, hasn’t happened again and taking pre-emptive steps to try stop it from happening again.