Need Help for Reactive HighCharts

Hello,

I am trying to use MeteorJS + Blaze + high charts to create a financial calculator. The intent is to allow users to add their incomes and expenses on the page and by adding those objects in the database, it would trigger a render on high charts.

The code below is my attempt to make the chart reactive by having a Session variable update the data for highcharts.

Client HTML code

<template name="profile">
<div class="col-md-6">
     <div id="savings-debt-chart" style="width:100%; height:400px;"></div>
 </div>
</template>

Client JS

Template.profile.onCreated(function () {
      Session.set("test", [
        ['Savings',   45.0],
        ['Debt', 55.0]
      ]);
});

Template.profile.onRendered(function() {

    const networthChart = $('#net-worth-chart');

    this.autorun(() => {
        totalInterestDebtChart.highcharts({
            chart: {
                plotBackgroundColor: null,
                plotBorderWidth: null,
                plotShadow: false
            },
            title: {
                text: "Total Interest / Total Debt"
            },
            tooltip: {
                pointFormat: '<b>{point.percentage:.1f}%</b>'
            },
            plotOptions: {
                pie: {
                    allowPointSelect: true,
                    cursor: 'pointer',
                    dataLabels: {
                        enabled: true,
                        format: '<b>{point.name}</b>: {point.percentage:.1f} %',
                        style: {
                            color: (Highcharts.theme && Highcharts.theme.contrastTextColor) || 'black'
                        },
                        connectorColor: 'silver'
                    }
                }
            },
        });

          const savingsDebtdata = Session.get("test"); 
          if (savingsDebtdata.length !== 0) {
            const chart = savingsDebtChart.highcharts();
            var savingsDebtdataObj = {
                type: 'pie',
                name: 'genre',
                data: savingsDebtdata
            };
            chart.addSeries(savingsDebtdataObj);
    });
}

 'change .incomeValue'(event) {
        event.preventDefault();
        Session.set("test", [
            ['Savings',   30.0],
            ['Debt', 70.0]
          ]);
  },

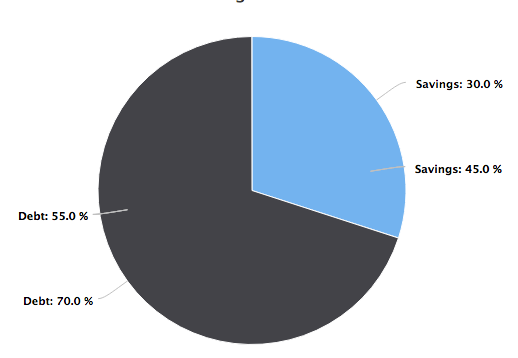
In the change incomeValue event, I am trying to change the value of the Session variable. It does recreate the chart, but it doesn’t remove the old chart like in the screenshot below:

31%20PM

It’s much cleaner to do this as two separate operations:

  1. Instantiate the chart outside of the autorun.
  2. Reactively update the data within the autorun. Note: don’t use addSeries.

Maybe something like this (I haven’t done a detailed analysis):

Template.chart.onCreated(function chartOnCreated() {
  this.subscribe('somePublication', parameters);
});

Template.chart.onRendered(function chartOnRendered() {
  this.data = [];
  // 1. Instantiate the (empty) chart outside of the `autorun` using this.data as the array of points
  this.chart = totalInterestDebtChart.highcharts({
    chart: {
      plotBackgroundColor: null,
      plotBorderWidth: null,
      plotShadow: false
    },
    title: {
      text: 'Total Interest / Total Debt'
    },
    tooltip: {
      pointFormat: '<b>{point.percentage:.1f}%</b>'
    },
    plotOptions: {
      pie: {
        allowPointSelect: true,
        cursor: 'pointer',
        dataLabels: {
          enabled: true,
          format: '<b>{point.name}</b>: {point.percentage:.1f} %',
          style: {
            color:
              (Highcharts.theme && Highcharts.theme.contrastTextColor) ||
              'black'
          },
          connectorColor: 'silver'
        }
      }
    },
    series: [
      {
        name: 'genre',
        data: this.data
      }
    ]
  });

  // 2. Reactively update the data within the `autorun`.
  this.autorun(() => {
    this.data = Session.get('test');
    this.chart.series[0].setData(this.data);
  });
});
1 Like

Thank you so much! This helped a lot!

1 Like