I’m trying to make a Meteor (1.1.0.2) site more performant on low-cpu devices, namely older mobile devices.
The app has frequent data updates being pushed out via DDP. The client usually has a view of 20-30 complex records, where at least one record gets updated every second during peak hours.
I’ve cut down the amount of data being sent over wire (via fields parameter of publish function), limited the logic that gets executed during (Blaze) rendering. It has helped, but still the updates slow the page down on older mobile devices.
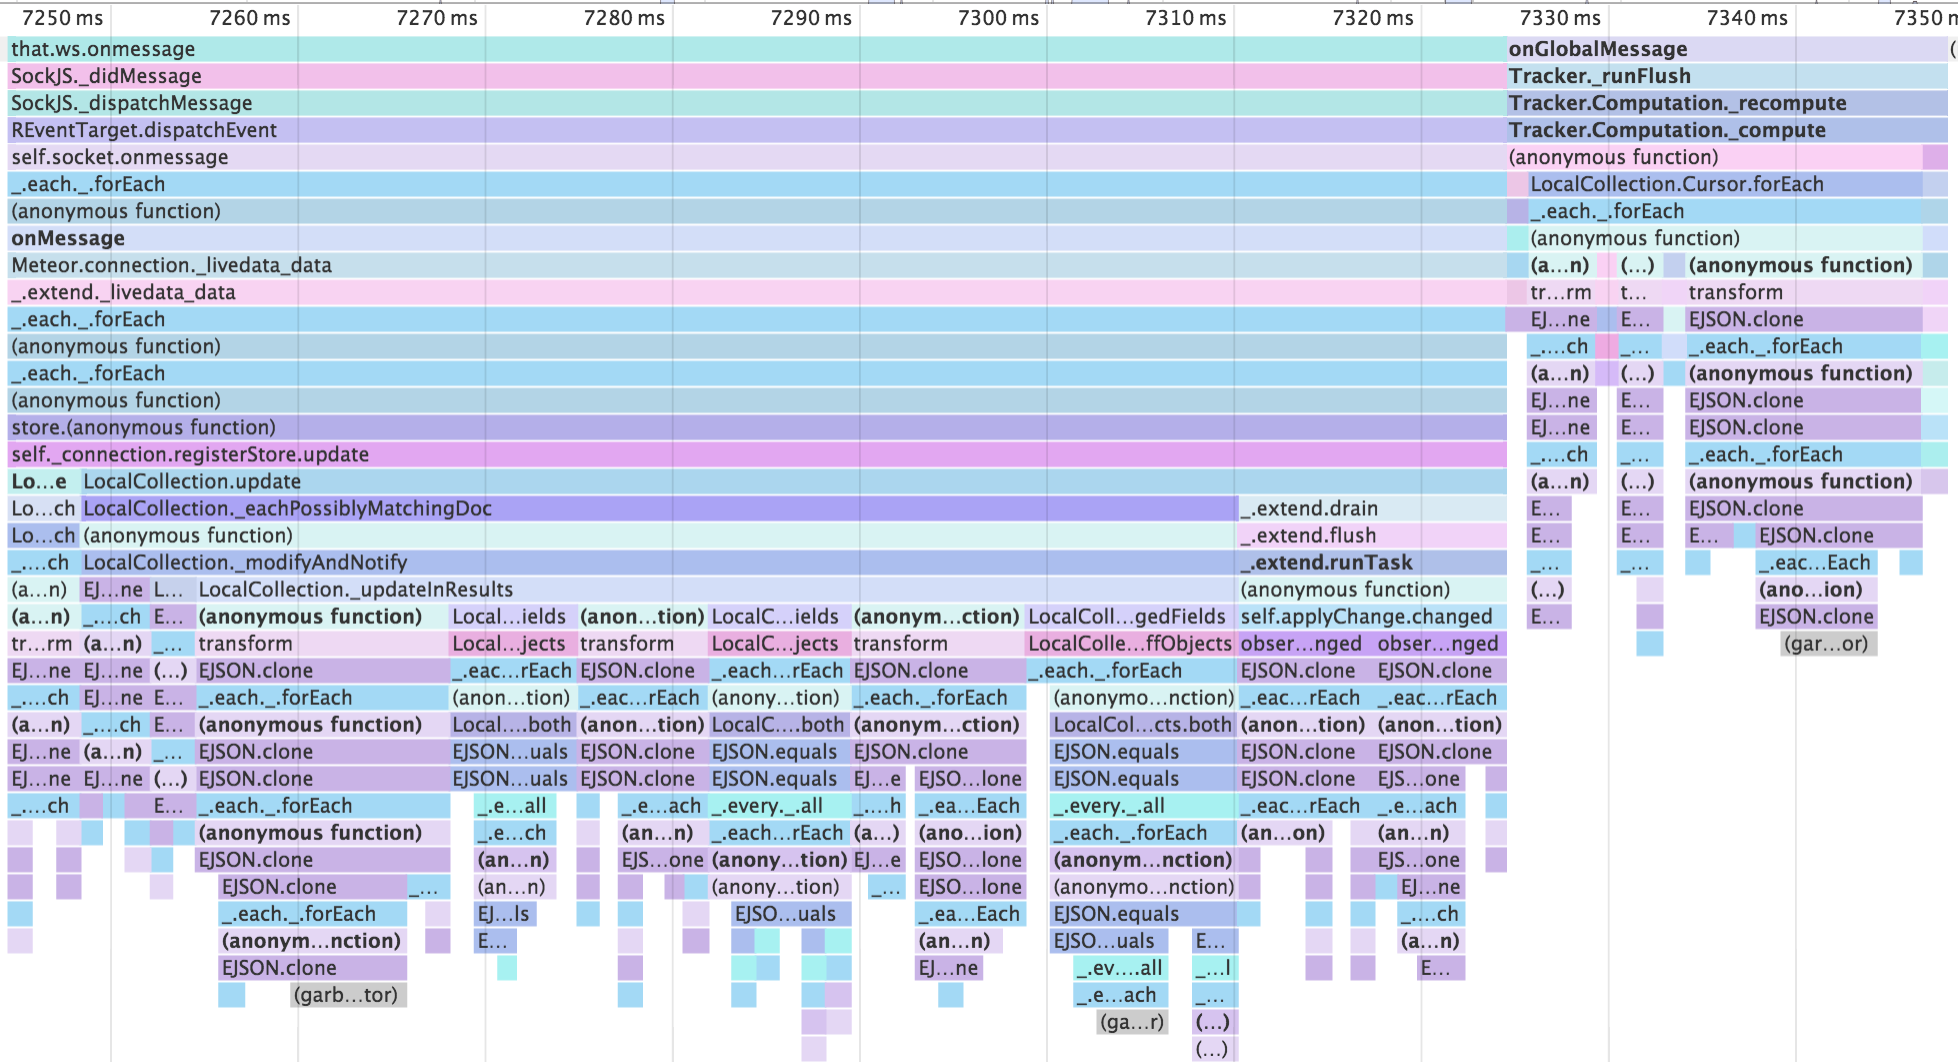
I’ve ran chrome CPU profiler on the app, and every data update is followed by a spike of CPU activity. Here’s an example:
It looks to me that the vast majority of time is spent processing incoming data (left block, 80ms), while updating tracker dependencies (right block, 20ms) takes distant second place, and actual view updates are insignificant (tail end of right block, 2ms). Bulk of this time (~50% according to profiler) gets spent in EJSON.clone.
Any ideas what I could do to improve the situation here?
PS The situation is roughly the same with Meteor 1.2.1.
I attempted to get a conversation started here to no avail. Ditching Blaze for React might be a solution, but I only say that with complete speculation and have no data to support such a claim.
It looks like my problem is tad bit different than yours: slowdowns I’m seeing have to do with incoming data update processing, rather than initial page loads.
And I’m hard-pressed to even find Blaze / template related code in these CPU spikes - it all seems to be minimongo / EJSON code.
I’ve tried completely removing any reactive client-side parts of the site, to the point where it setups subscriptions and renders a blank template. All Tracker.autorun blocks commented out, no reactive helpers getting called. And the CPU spikes were still there.
The smaller, right-side block that took 20ms in the original example has disappeared. But the bigger left block is still there, still with roughly similar structure, still taking roughly similar time. My data structures are 30-50KB objects, made up of strings, booleans and arrays of simple objects. Cutting those objects down to just { _id: ... } predictably eliminates the spike to just couple ms.
I believe the above eliminates view layer / Tracker as possible culprits.
So that leaves EJSON / minimongo. Why does updating records in a collection need to clone so many objects? Modifying freshly received objects before shoving them in collections should not have any side-effects Maybe it’s due to the same code being re-used in contexts where modifying the original objects is not desirable?
PS The collection in question has a transform function, but removing that doesn’t seem to make any difference.
That flame chart is somewhat difficult to read. Though if I squint I get the impression most of the time is spent parsing your large EJSON objects. I don’t see the gc anywhere in the list so the frequency of updates isn’t bad.
The Chrome profiler tools are pretty thorough. If you spend some time learning them you should be able to drill down to the particular function causing you issues.
well, as you probably already know, the diff and changes in DDP are on top level document level.
what are the changes in your documents?
if it is not on top level document, it needs to send whole subdocument every time as long as I know.
Are you limiting your pub/sub to only the fields that you need to show in the client? My collection objects typically have more properties than are what is essential to send over the wire.
From what I’ve seen, the performance falls drastically with nested objects - 72k symbols in flat object get processed in 8ms, while the same amount of symbols in five-level deep arrays take >70ms to process.
You could just use Meteor.methods to get data and poll for new updates regularly if needed. You can still use MiniMongo with local collections I think.
 Maybe it’s due to the same code being re-used in contexts where modifying the original objects is not desirable?