Hi. We’ve had a problem for the past month on our production server and I can’t seem to find a solution. I can’t even find anyone on this or other forums with a similar issue.
At some point during a cycle (inbetween restarts) the server will start spiking memory. I’ve found a lot of topics where the memory will just keep climbing until the server halts but ours just has massive spikes up to 400+ mb (the app idles at around 140mb) and then drops again, only to start ascending again right after.
Here’s what I have learned/done already:
I’ve already looked at observers and if they’re being deleted correctly. Everything seems fine there as far as I can tell.
The app will even start spiking memory at night when noone is using it (all our users are in the same timezone).
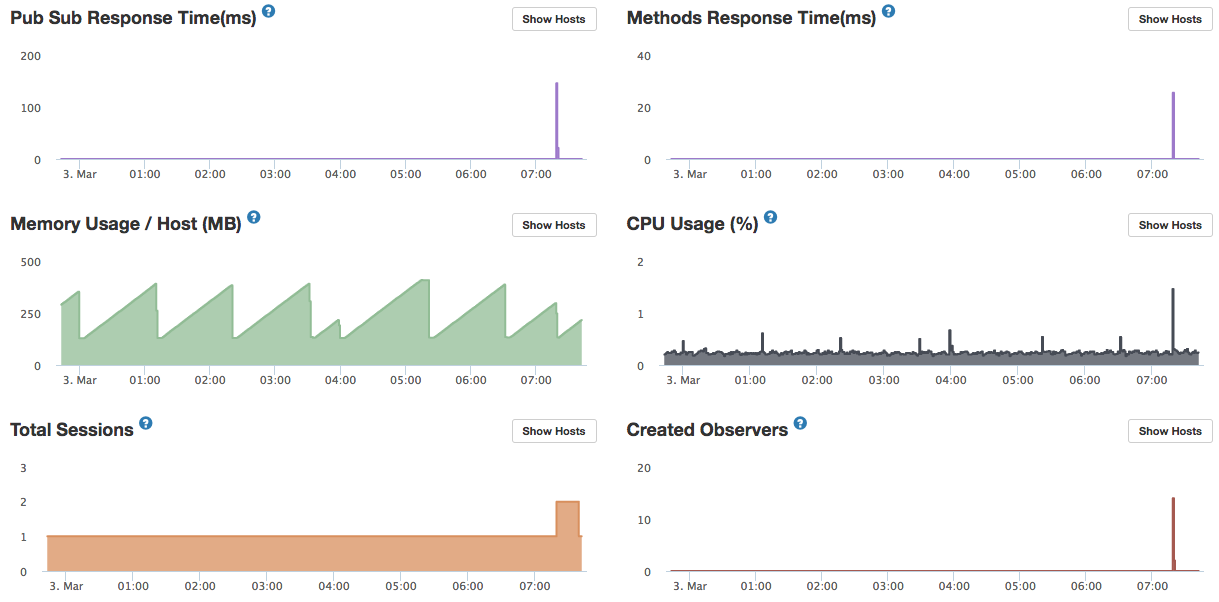
I have 2 publications with a large data set but I’ve found several people with much larger publications so I doubt they’re the problem. One is a regular publication of about 1800 very small documents. The other is a reactive aggregation of about 2300 documents. All other large publications use pagination, they observe a pretty large dataset but only ever send maximum 50 docs to the client at once.
This screenshot shows the spikes during night time.
So far the memory spikes have not become a problem yet but I do feel uneasy about them. At the very least I’d like to understand why the server is doing what it’s doing and what sets it in motion.
This looks like garbage collection occurring - the sawtooth shaped memory graph supports this theory along with the increase in CPU usage around the time each drop in memory occurs. It’s a normal operation for NodeJS/V8 so I fairly sure you don’t have anything to worry about. I see similar patterns on idle Galaxy containers for my app.
Thanks for your reply the the linked article.
I realise that it’s garbage collection occurring but what I don’t get is the fact that that memory is being occupied again by something right after, and without user interaction.
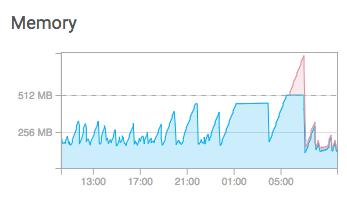
Not only that, yesterday, my server went way over the memory limit and into swap memory.
Is there a way in Kadira to check what the memory is used for? The memory graph in Kadira is a bit of a standalone thing, no real ties to publications, live queries, methods… or am I missing something?
I think about that every now and again as well but then I remember we implemented Kadira because we saw the memory spikes on the server metrics in the first place. I doubt it but I might give it another try in the future.
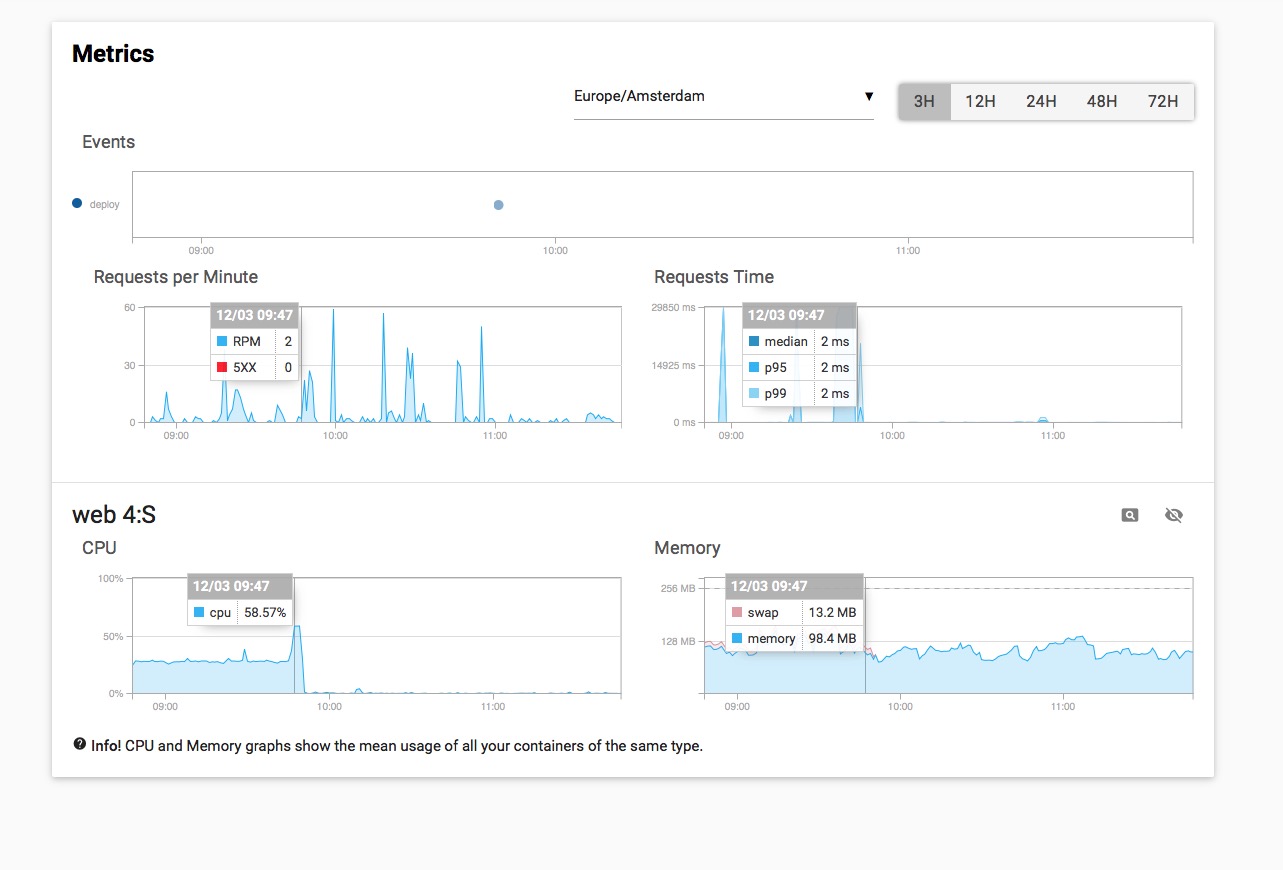
Maybe check out Kadira again. It messed up my server at random times (mostly at a bit higher loads, but not always). It made the server stall for ~20-30 secs and CPU was always at 27%. Now I removed it, the problems are gone and the CPU usage also. Guess at which time I deployed the version without Kadira (via Meteorchef):
Just an update: Server has been showing the spikes off and on for a couple of months now and it seems to be just garbage collection as some of you suggested. We’ve stopped worrying about it since everything else seems to be just fine.
I’m facing the same issue and for me it’s definitely Kadira. When removing the package, everything is fine. Yet I don’t have a satisfying solution.
Funny also, that it happens only on my front end apps where I don’t have any method or publication nor any other backend logic. On my backend heavy app I don’t see those spikes.
@glennn
They are running on separate containers. And yes, the front end containers are running with only 256 MB RAM whereas the backend currently has 512.
But I have also another front end app running without Kadira installed (it’s our internal admin dashboard, so there I don’t need Kadira). And this app is also running fine, never experienced spikes.
I’ve played with the idea that it was more likely to happen on higher RAM boxes smaller ones when I was debugging this but it always seemed very illogical.