[RESOLVED] Which is a good practice to observe 1000 elements?

Hello, I am working in a monitoring system where I have to monitor about 1000 IoT devices. Actually, these devices are “users” of my meteor app, where they are configured in Single Board Computers each one. So, I used the package of socialize:user-presence to monitor their activity (if they’re online or offline).

I did a publication tu return all these devices and visualize them in a map, where I can identify if any of them are online or offline. This is a preview of that screen:

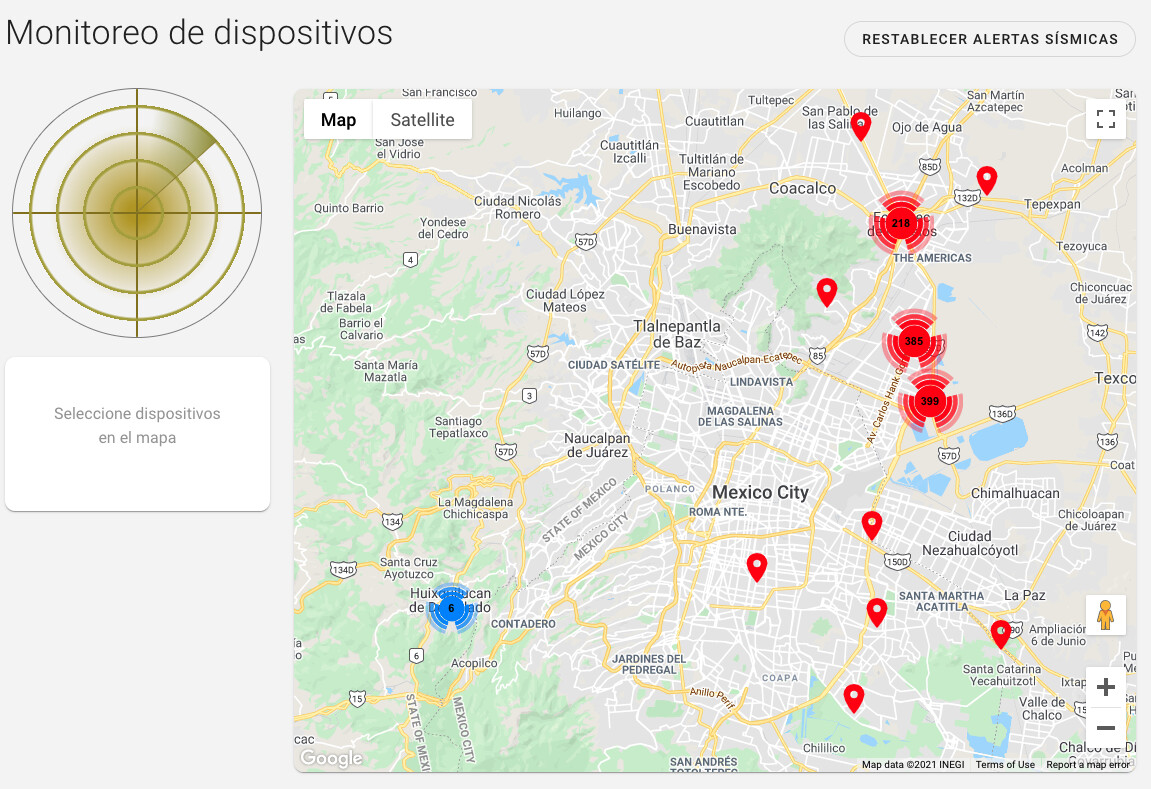
*I used a plugin of google maps to do clusters of markers when they’re very together.

I noticed that in a virtual machine of aws, the first time to load this data is fine, but the next times it starts to get very slow all the system (it takes a long time to log in or see some other screen), and I guess that it is caused by the publication because I saw the database logs and I identified that the query is called several times and I think this provoke a bottleneck.

[root@ip-172 monitoreo-sismos]# docker-compose logs -t --tail=1 mongo
mongo      | 2021-02-15T22:58:35.448582052Z 2021-02-15T22:58:35.448+0000 I  COMMAND  [conn4] command monitoreo.users command: getMore { getMore: 8965079632326770040, collection: "users", batchSize: 1000, lsid: { id: UUID("4ce476cd-c250-4b8e-8873-7201fa52f2c5") }, $db: "monitoreo" } originatingCommand: { aggregate: "users", pipeline: [ { $match: { profile.profile: "device", profile.isDeleted: false, profile.idCompany: "mjifJahSjrfnvsvXY" } }, { $lookup: { from: "users", localField: "profile.idCompany", foreignField: "_id", as: "company" } }, { $unwind: { path: "$company", preserveNullAndEmptyArrays: true } }, { $lookup: { from: "audios", localField: "profile.defaultAudio.idAudio", foreignField: "_id", as: "audio" } }, { $unwind: { path: "$audio", preserveNullAndEmptyArrays: true } } ], cursor: {}, lsid: { id: UUID("4ce476cd-c250-4b8e-8873-7201fa52f2c5") }, $db: "monitoreo" } planSummary: IXSCAN { profile.idCompany: 1 } cursorid:8965079632326770040 keysExamined:314 docsExamined:314 cursorExhausted:1 numYields:3 nreturned:904 queryHash:A300CFDE planCacheKey:A2B33459 reslen:1861557 locks:{ ReplicationStateTransition: { acquireCount: { w: 3621 } }, Global: { acquireCount: { r: 3621 } }, Database: { acquireCount: { r: 3621 } }, Collection: { acquireCount: { r: 3620 } }, Mutex: { acquireCount: { r: 3618 } } } storage:{} protocol:op_msg 163ms


[root@ip-172 monitoreo-sismos]# docker-compose logs -t --tail=1 mongo
Attaching to mongo
mongo      | 2021-02-15T22:58:43.741503153Z 2021-02-15T22:58:43.741+0000 I  COMMAND  [conn5] command monitoreo.users command: getMore { getMore: 4099534238120887219, collection: "users", batchSize: 1000, lsid: { id: UUID("4ce476cd-c250-4b8e-8873-7201fa52f2c5") }, $db: "monitoreo" } originatingCommand: { aggregate: "users", pipeline: [ { $match: { profile.profile: "device", profile.isDeleted: false, profile.idCompany: "mjifJahSjrfnvsvXY" } }, { $lookup: { from: "users", localField: "profile.idCompany", foreignField: "_id", as: "company" } }, { $unwind: { path: "$company", preserveNullAndEmptyArrays: true } }, { $lookup: { from: "audios", localField: "profile.defaultAudio.idAudio", foreignField: "_id", as: "audio" } }, { $unwind: { path: "$audio", preserveNullAndEmptyArrays: true } } ], cursor: {}, lsid: { id: UUID("4ce476cd-c250-4b8e-8873-7201fa52f2c5") }, $db: "monitoreo" } planSummary: IXSCAN { profile.idCompany: 1 } cursorid:4099534238120887219 keysExamined:314 docsExamined:314 cursorExhausted:1 numYields:3 nreturned:904 queryHash:A300CFDE planCacheKey:A2B33459 reslen:1861557 locks:{ ReplicationStateTransition: { acquireCount: { w: 3621 } }, Global: { acquireCount: { r: 3621 } }, Database: { acquireCount: { r: 3621 } }, Collection: { acquireCount: { r: 3620 } }, Mutex: { acquireCount: { r: 3618 } } } storage:{} protocol:op_msg 168ms


[root@ip-172 monitoreo-sismos]# docker-compose logs -t --tail=1 mongo
Attaching to mongo
mongo      | 2021-02-15T22:58:52.055748001Z 2021-02-15T22:58:52.055+0000 I  COMMAND  [conn4] command monitoreo.users command: getMore { getMore: 1502150716348272659, collection: "users", batchSize: 1000, lsid: { id: UUID("ee7eb77e-8842-49a9-9a4b-579dbe76d721") }, $db: "monitoreo" } originatingCommand: { aggregate: "users", pipeline: [ { $match: { profile.profile: "device", profile.isDeleted: false, profile.idCompany: "mjifJahSjrfnvsvXY" } }, { $lookup: { from: "users", localField: "profile.idCompany", foreignField: "_id", as: "company" } }, { $unwind: { path: "$company", preserveNullAndEmptyArrays: true } }, { $lookup: { from: "audios", localField: "profile.defaultAudio.idAudio", foreignField: "_id", as: "audio" } }, { $unwind: { path: "$audio", preserveNullAndEmptyArrays: true } } ], cursor: {}, lsid: { id: UUID("ee7eb77e-8842-49a9-9a4b-579dbe76d721") }, $db: "monitoreo" } planSummary: IXSCAN { profile.idCompany: 1 } cursorid:1502150716348272659 keysExamined:314 docsExamined:314 cursorExhausted:1 numYields:3 nreturned:904 queryHash:A300CFDE planCacheKey:A2B33459 reslen:1861557 locks:{ ReplicationStateTransition: { acquireCount: { w: 3621 } }, Global: { acquireCount: { r: 3621 } }, Database: { acquireCount: { r: 3621 } }, Collection: { acquireCount: { r: 3620 } }, Mutex: { acquireCount: { r: 3618 } } } storage:{} protocol:op_msg 168ms

Logs of node app container doesn’t show any error. (shows only the Starting app. . .)

Also, I displayed these devices in other view where I have a datatable, and in this case, I fixed it using the server side pagination technique, but in the monitoring view I wonder which could be a better solution to observe all the devices without overload the server?

Notes:

  • Specifications of virtual machine: 2vCPUs, 4 GB of RAM, 80 GB HDD, CentOS, deployed with docker image (disney/meteor-base)

  • In my computer doesn’t happen that issue because I guess is due to specs of my machine. Macbook Pro, core i7 six core, 16gb ram, ssd

  • Meteor 2.0, Mongo 4.4, Node 12.18, Vue 2.6.11 (akryum)

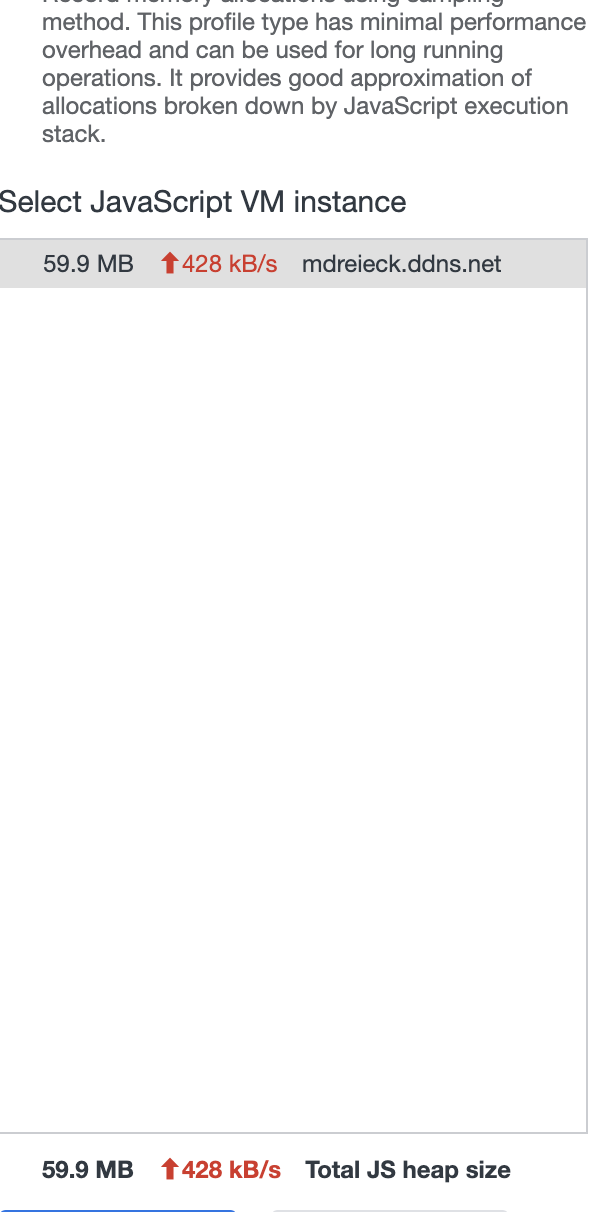
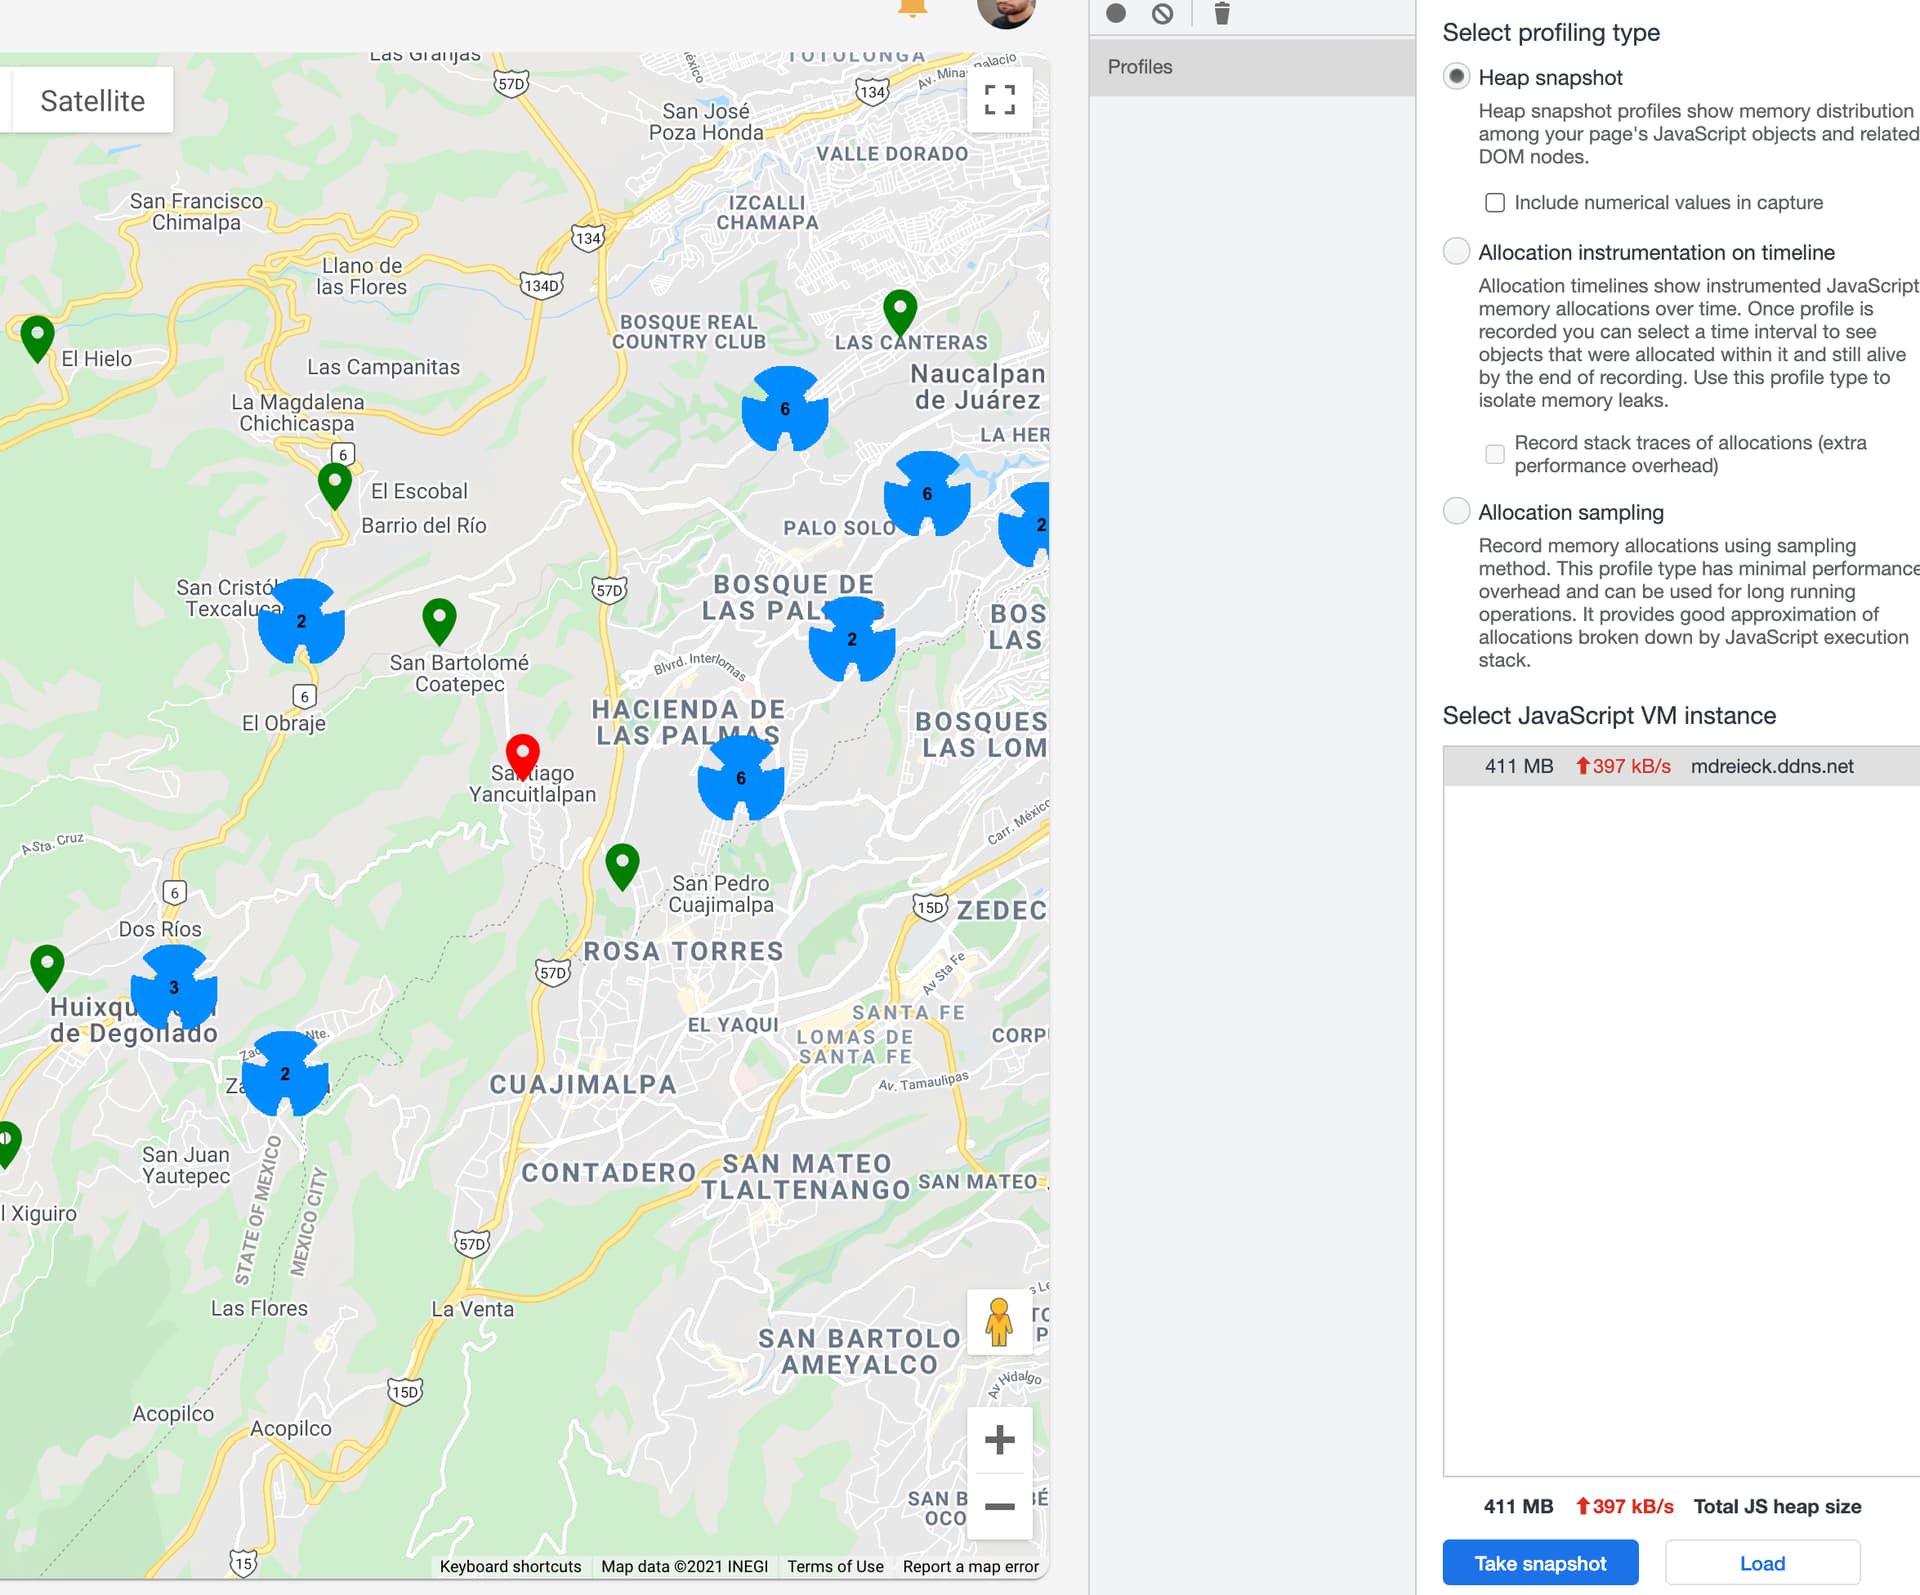
  • I am using indexes in certain fields (where I do queries to database), and also, I am considering to optimize my query, to return only the necessary information, since my current query is:


const monitoringDevicesPublication = new PublishEndpoint('monitoring.devices', function(idCompany, deleted = false) {
	let queryMatch = {
		'profile.profile': StaticProfiles.device.name,
		'profile.isDeleted': deleted
	};
	if (idCompany) {
		queryMatch['profile.idCompany'] = idCompany;
	}
	//TODO: Optimize query removing innecesary fields with $project operator
	ReactiveAggregate(this, Meteor.users, [
		{
			$match: queryMatch
		},
		{
			$lookup: {
				from: 'users',
				localField: 'profile.idCompany',
				foreignField: '_id',
				as: 'company'
			}
		},
		{
			$unwind: {
				path: '$company',
				preserveNullAndEmptyArrays: true
			}
		},
		{
			$lookup: {
				from: 'audios',
				localField: 'profile.defaultAudio.idAudio',
				foreignField: '_id',
				as: 'audio'
			}
		},
		{
			$unwind: {
				path: '$audio',
				preserveNullAndEmptyArrays: true
			}
		}
	], { warnings: false });
});

Hope someone give me an advice to this situation. Thank you for advance.

1 Like

I reviewed again, and in my computer happens too (the system get very slow). I was doing some tests and I found out an issue related to tunguska:reactive-aggregate@1.3.5 . I downgrade to 1.3.3 and the issue has gone (1000 elements are fetched in seconds and system continues working normally).

//CC @robfallows am I remembering right that the tunguska:* packages are yours?

1 Like

They are.

A change to observer set up was made in 1.3.5 - ironically, to improve performance. If this is causing problems for you, please raise an issue on GitHub.

2 Likes

That is a fun problem and project.

I’m just curious how often do those devices turn on/off on average?

Aggregate is expensive operation in Mongo, so I’d avoid it all together if possible, specially when you’ve 1k docs observed.

The other thing, I’d personally consider is an alternative data structure. Since we only care about device Ids and status (0/1) then it might possible to store the info in one doc as an array or map.

3 Likes

At this moment I really don’t know (since this is a test server), but the client expect to have all their devices in operation 24/7 (markers should be green). Moreover, these devices can receive alerts about earthquakes/seisms that may occur in the country, and in these cases, the markers that received this alert should turn blue. Also, thanks to pub/sub is possible to send instructions to IoT devices from the web app and perform remote control over them.

Thank you so much for the advice, I will take it into account. Fortunately, I found the bug that made the application get freeze and the test server became fast again, even looking at 1000 elements. This is great because with little hardware (4gb memory, 2vCPUs), Meteor is able to handle such a load quite well.

1 Like

Is it possible for you to detail what you found to be the cause, not only for personal closure having read through the thread lol, but also so others can possibly learn from how you solved it?

I found a bug in tunguska:reactive-aggregate package in its v1.3.5 (latest). It seems that it enters in a loop that causes the meteor app to get freeze. So, as an alternative solution I did a downgrade to the last stable version, which is v1.3.3 (maybe 1.3.4 is stable too, but I used to use 1.3.3).

I have already reported the issue on github. So, we hope to have in the following version (1.3.6), the bug fixed.

1 Like

Thank goodness I read this. My site has been hitting 100% CPU and I had to keep cranking it up on Galaxy. At one point I was at 2x Octo and still hitting 100%. Wasn’t sure what was going on but check in here regularly and bumped into this thread. Rolling back to 1.3.4 fixed it. Whew!

4 Likes

Hi, some months ago this application was launched, however, we noticed that if a user keeps for a certain time in the monitoring view, then the app becomes very slow and we have to reload the page to release memory from the client-side and make fast again the usage of the application. In the following pictures we can see the memory used for each scenario:

After reload page, this is the memory used:


59.9 MB of memory used

After waiting for some minutes (within 5 minutes)


411 MB of memory used

It is worth mentioning that this monitoring view has a subscription that observes about 40 devices (users connected) in the map. Besides, each device is updating its data (voltage and temperature) every 10 seconds. So, this data can be visualized by clicking on each device and a modal window will appear with the corresponding data for the device selected.

I was looking into the cause of what makes the application get slow and I conclude that it can be related to the subscription because if I do zoom in to view a specific device then the memory is reduced and this is because the subscription receives a parameter which it is the number of present devices in the map, so, if only a device is observed by the publication, then this makes an update for the subscription and this allow to decrease the memory in the client-side (browser).

So, I was wondering if anyone knows how to refresh memory used by a subscription each certain time? I think this is the solution, but I am opened to listen to others.

You might consider poll & diff for your case: node.js - Meteor MongoDB subscription delivering data in 10 second intervals instead of live - Stack Overflow.

Can you detail on the subscription query. Are you subscribing to limit = 1, sort by date (only the latest 1 record)?

1 Like

Hi @paulishca , thank you for the advice, I will check it.

Regarding your questions:

Can you detail on the subscription query.

This is the publication:

const monitoringDevicesPublication = new PublishEndpoint('monitoring.devices', function(idCompany, deleted = false) {
	let queryMatch = {
		'profile.profile': StaticProfiles.device.name,
		'profile.isDeleted': deleted
	};
	if (idCompany) {
		queryMatch['profile.idCompany'] = idCompany;
	}
	ReactiveAggregate(this, Meteor.users, [
		{
			$match: queryMatch
		},
		{
			$lookup: {
				from: 'users',
				localField: 'profile.idCompany',
				foreignField: '_id',
				as: 'company'
			}
		},
		{
			$unwind: {
				path: '$company',
				preserveNullAndEmptyArrays: true
			}
		},
		{
			$lookup: {
				from: 'audios',
				localField: 'profile.defaultAudio.idAudio',
				foreignField: '_id',
				as: 'audio'
			}
		},
		{
			$unwind: {
				path: '$audio',
				preserveNullAndEmptyArrays: true
			}
		},
		{
			$project: {
				'status': 1,
				'profile.name': 1,
				'profile.model': 1,
				'profile.serialNumber': 1,
				'profile.type': 1,
				'profile.address': 1,
				'profile.reset': 1,
				'profile.location': 1,
				'company.profile.name': 1,
				'profile.siren': 1,
				'profile.simulacrum': 1,
				'profile.defaultAudio': 1,
				'profile.hardwareStatus': 1,
				'profile.seismicAlert': 1,
				'profile.m3h': 1,
				'audio': 1
			}
		}
	]);
});

Using PublishEndpoint from peerlibrary:middleware package and ReactiveAggregate from tunguska:reactive-aggregate

This is the subscription:

meteor: {
	$subscribe: {
        'monitoring.devices': function() {
          const params = [];
          if (Meteor.user().profile.profile === 'company') {
            params.push(Meteor.userId());
          }
          return params;
        }
      },
	  devices() {
			return Meteor.users.find({ _id: { $ne: Meteor.userId() } }).fetch();
		}
	}

Using Vue 2 (akryum package)

Are you subscribing to limit = 1, sort by date (only the latest 1 record)?

I am subscribing to all devices associated with a company (idCompany param) when a company is logged in. Otherwise, if a user administrator is logged in, then I don’t send any parameters to the publication and it subscribes to all devices from all companies.

Correction on this:

the subscription receives a parameter which it is the number of present devices in the map

According with the publication that I share you, this doesn’t happen then it always subscribe to the same devices regardless of devices present in the map (by doing zoom in or zoom out). Sorry for that mistake, I had forgotten the code of the publication.

ok … looks a bit cumbersome to be frank. Maybe not the best DB schema.
You might be doing better with cult-of-coders/grapher but the learning curve with that is a bit … intensive.

2 Things:

  1. Are you supposed to ‘fetch()’ your devices? You normally subscribe and return a cursor which you map over in order to create your UX.
  2. On the map I don’t see company data. Do you only show it on hover or so, or on the side of the screen somewhere? If it is not permanently in view, you don’t subscribe to it. You pull it on hover or click or some user actions.
1 Like
  1. Are you supposed to ‘fetch()’ your devices? You normally subscribe and return a cursor which you map over in order to create your UX.

Yes, I need the information of each device to show it in a modal window when one of them is clicked.

  1. On the map I don’t see company data. Do you only show it on hover or so, or on the side of the screen somewhere? If it is not permanently in view, you don’t subscribe to it. You pull it on hover or click or some user actions.

it is showed when a marker (devices) on the map is clicked and then appears a modal window with the device information (including its company). However, I think this publication can be optimized as you said by removing some fields (including the company data) and pull them on click events over each device.

Thank you again, and I hope this helps to solve the main problem.