A couple more thoughts and clarifications:
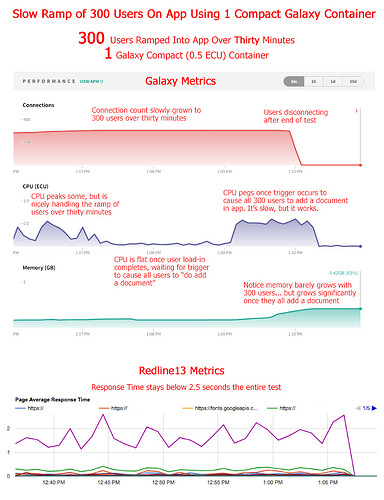
@elie @tomsp When I say “simultaneous logins” I’m talking about “first time loads” of my app, at the exact same time (+/- a few seconds), with users who have never loaded the app before. And I’m not actually talking about a Meteor.login call because my app doesn’t require a Meteor.login. Similar to todos, a user hits my app and there’s some default data that loads based on the URL they entered. Definitely not the same as “concurrent users”. As far as a lot of concurrent users, on one Compact container my app can actually load 300 users, slowly, and it works fairly well. Here’s a graph demonstrating…
Though, I found about 300 users was the max before the Compact container crashes when all my test users do something at the same time (e.g. create a document) - and this simultaneous behavior is typical of my app’s usage. This isn’t bad for one Compact container. In other tests I was able to load 650 users on one Compact container with plenty of memory, CPU, etc. If I weren’t having these test users all do something at the same time in the test, the container would probably handle that many users fine (that’s my theory at least - should probably test this).
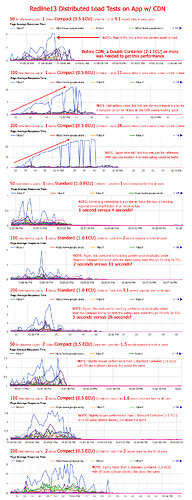
I was thinking that all this may not actually be that poor of performance. Handling a burst of 40 first-time hits to your app at the same time isn’t bad for a Compact (0.5 ECU) container. The typical app (that doesn’t have my crazy use-case OR doesn’t have some publicity event that triggers a bunch of instant usage) would likely never hit 40 simultaneous first-time downloads until the app had a much, much higher amount of traffic. Your simultaneous first-time download count would be much lower at any given time - i.e. it would take having thousands of organic users to get to 40 simultaneous first loads within a few seconds. So if you ratchet up to a Standard or Double container, you’re going to be fine for a long time. Well, as long as you don’t end up on Product Hunt, Slashdot, etc. ![]() (which has happened to users on this forum and their app consequently DOS’s hence this thread).
(which has happened to users on this forum and their app consequently DOS’s hence this thread).
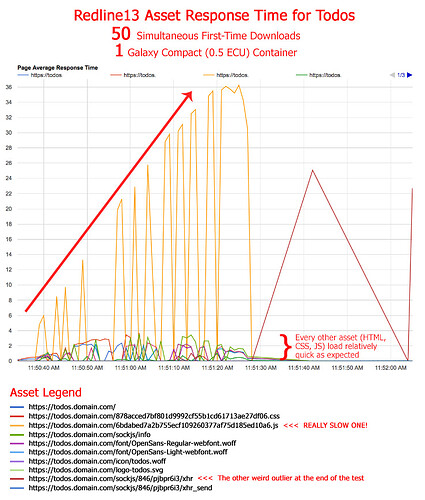
@hwillson There is still perhaps an issue here. I blew up a graph of the Redline13 Average Response Times for the todos app with all the various assets that get downloaded (HTML, JS, CSS, fonts, images, etc.) They all load really quickly except for the one JS file. That’s the outlier. I was mistakenly thinking there was more than one Meteor JS file that gets downloaded, but as @raphaelarias said, there’s a single big one. The issue is when I have this “burst of users” all those assets load very quick, except the one JS file. You can see them in the below graph (and in my above graphs). All those colored lines as the bottom are those various assets. And you can see, they’re still loading fast in the graph compared to the one main JS file that’s the outlier growing linearly in delay. With that said, the JS file is much larger than the other assets at 541KB (most of the others are less than 20KB and some are only a few bytes). This JS file matches exactly to the delay you can witness when loading the app. That delay is the population of data into your app templates. I should say, it’s the completion of loading of data into your templates because you can see in your app (both in my app and todos) that the data slowly loads, template by template, and populates over the thirty to sixty seconds. How Redline13/PhantomJS knows that the data hasn’t loaded and how that relates to the JS file - I don’t know. That’s for the MDG devs. I don’t know if that JS file simply doesn’t load entirely until the data is ready and/or it’s waiting for some return value from that JS file? This delayed behavior is the issue that I would report. Why does everything else load fairly fast but the data? Even under major load? It’s not the database @iDoMeteor because when you crank up CPU, the data loads super fast as expected. Perhaps it’s something to do with the “data querying and deliverying” process getting blocked by the Meteor server trying to download all those 541KB JS files to all the simultaneous users. If it weren’t for this outlier, the load times of all the other assets (colored lines at the bottom of the graph) are actually fairly reasonable given the simultaneous hits. These smaller asset response times are more in line with what I would expect.
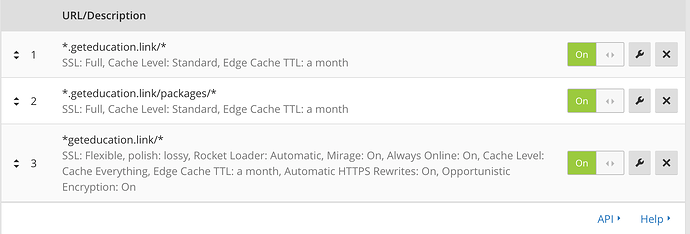
@raphaelarias The Cloudflare caching is promising, especially given the above. ![]() I will definitely try and test. So the idea is that you identify all assets (HTML, JS, images, etc.) and have Cloudflare cache these and deliver them before your Meteor server gets the chance? It seems the only downside to this is when you update your app, you’ll have to wait for Cloudflare to re-cache your JS asset right? Have you tried this and it works for you? AWS CloudFront can do something similar right? It would be cool if there were some way to tell your Meteor app about your own CDN to deliver the big JS file and not rely on a middleware service to intercept the traffic, but that’s cool if it works.
I will definitely try and test. So the idea is that you identify all assets (HTML, JS, images, etc.) and have Cloudflare cache these and deliver them before your Meteor server gets the chance? It seems the only downside to this is when you update your app, you’ll have to wait for Cloudflare to re-cache your JS asset right? Have you tried this and it works for you? AWS CloudFront can do something similar right? It would be cool if there were some way to tell your Meteor app about your own CDN to deliver the big JS file and not rely on a middleware service to intercept the traffic, but that’s cool if it works.
@XTA Your hosting setup looks really cool. If I find I will need to scale way up, I’ll probably have to move off of Galaxy for costs reasons. I do like Galaxy though for its metrics feedback (and now with Meteor APM especially) and the ability to scale up container counts with one click is amazing. And helpful in my use-case because I can ask clients when their large-audience event is happening and then I can just scale up containers temporarily to serve the crowd. The problem is this is annoying, non-scalable with a lot of events, and just generally prone to forgetting and/or leaving a ton of Quad containers turned on. But it works for now, until I figure out how to get better performance with less CPU power. What country is OVH in? Do they use their own cloud or are they built on top AWS, etc.? Is it easy for you to add more “containers” if needed?
@waldgeist Yeah I don’t think DDP Limiting would help here because it’s for per connection rate limiting which isn’t my issue.


 This explains a lot.